How Hedge Funds May Impact The Market This Week
What Friday’s Market Action
Tells You
It was another eventful
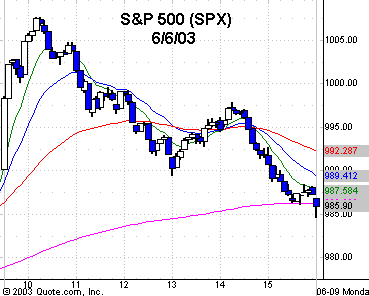
first Friday of the month, and the game was on. The S&P futures
were taken up 9 points pre-9:30 a.m. ET NYSE opening to 1000, forcing a big gap
opening for stocks, much to the market makers and specialists delight. Retail
came charging in and they got it right between the eyes, which is what everyone
deserves when they buy into hype. The futures traded up another 8 points to
1008.50 and at 10:00 a.m., our favorite reversal time, the game was over, and
the market went south into the close of 987.50 on the E-mini S&P.Â
It was a big volume day, with NYSE volume at 1.8
billion, the volume ratio 45, and breadth -47, as the early up was offset by the
afternoon reversal. At the highest point in the game, the SPX
(
$SPX.X |
Quote |
Chart |
News |
PowerRating)
and Dow
(
$INDU |
Quote |
Chart |
News |
PowerRating) were both up about +1.8%, while the
(
QQQ |
Quote |
Chart |
News |
PowerRating)s were +3.4%
and the
(
SMH |
Quote |
Chart |
News |
PowerRating) was +4.9%. At day’s end, the SPX was -0.2%, the QQQs -1.8%,
and SMH -1.2%, so it was quite a reversal. The Nasdaq
(
$COMPQ |
Quote |
Chart |
News |
PowerRating) ended at
-1.1%.
The QQQs had the biggest volume day of the year
at 157 million. Previous big days were March 13, the first rally day of this
current move, where the QQQ gained +3.4% on 128 million shares, and then a
follow-through day on March 17, with the QQQs +3.4% again, but on 141 million.
The SMH had its second-biggest volume day of this rally at 12.8 million, with
the most volume having been the 14 million on April 16, the day after the tax
deadline when money is expected to enter IRAs, etc.
For Active Traders
Friday’s early spike on the SMH at 32.47 put it
+21% above its 200-day EMA and right at its 2.0 volatility band on Friday, in
addition to longer-term extended bands. Needless to say, too much too fast. The
QQQ hit a 31.47 intraday high, which is right at the 31.50 level, which is the
.50 retracement to the Dec.1 43.24 high. The 2.0 one-day volatility band was
31.60. There is a confluence of three awareness levels just above at 32.17,
32.35 and 32.62.
Active traders that utilize the volatility bands
in first-hour strategies had a big day. If you traded the initial Trap Door in
the S&P E-mini, it only declined 2 points from entry before reversing and
stopping you out with a small loss. The next attempt was the gold mine. The SPX
traded up to 1007.66, which was right to its 2.0 volatility band of 1009.24,
then reversed. Trading the E-minis, you had a three-bar reversal entry below
1005.50, and then a mini 1,2,3 entry below 1002. They traded down to 989.25,
right on the .618 retracement level to Thursday’s 977.50 low, which is 989.34.
The rally from here was to 998, then sold off to the 986 intraday low, closing
at 989.
Today’s Plan Of Attack
Friday was a wide-range-bar reversal day on
significant volume, but the major indices are still above all of their rising
moving averages, and in fact, the 8-day EMA for the SPX is down around 975, and
the 20-day EMA is around the 954 zone, with the trading-range breakout level
below that at 949. The major indices haven’t had more than a two-bar correction
since April 7, so there is plenty of downside room for a minimum of a three- to
eight-bar decline. Also, the next time dates are June 11, and then June 14,
which is a Saturday, so look to the 13th, and/or the 16th.
Friday was a rubber band snap day, and was
unnerving to many hedge funds sitting on some excellent marked to the mark
profits so far in this rally, but it’s not a profit until you sell it. I would
expect some selling from these funds into any reflex up this week.Â
Have a good trading day.

Five-minute chart of Friday’s SPX with 8-, 20-,
60- and 260-period
EMAs

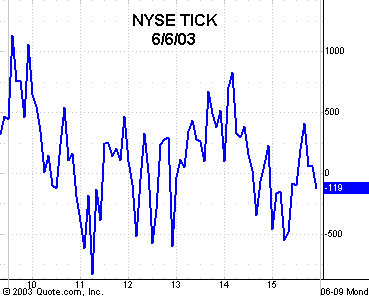
Five-minute chart of Friday’s NYSE TICKS
