Tuesday’s Levels
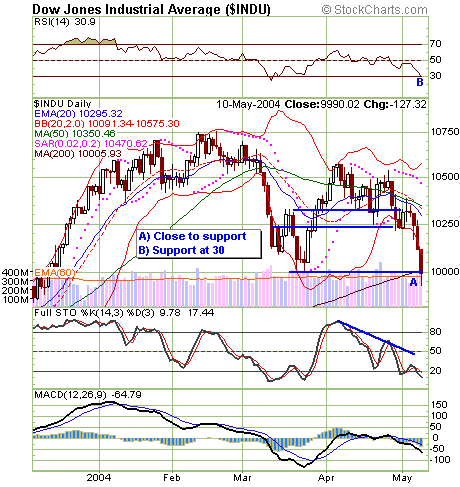
Tuesday Recap:Â In predictions
over the past week have been pointing to a test of Dow 10000. That occurred.Â
Further, the predictions also noted that 10000 would likely be broken when
tested. That occurred on Monday as the cash Dow moved sharply lower out of the
gates, tested support and bounced to 10050 before finding sellers that took the
market’s measure to blow past Dow 10000 and ultimately found support just under
9950. From there the Dow bounced to peek its head above 10000 and touch the
200-day moving average. However, sellers pushed the key index lower from here,
ultimately making slightly lower lows before rallying into the close to end just
under 10000, finishing down 127 at 9990.Â
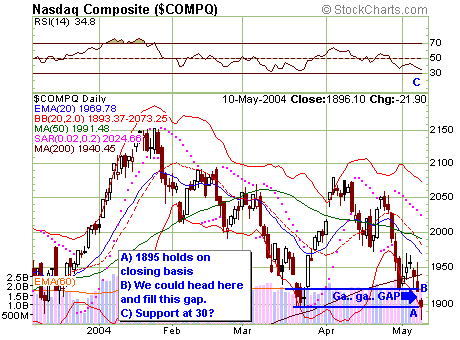
The NASDAQ was the strongest relative index on
Monday, closing just above our predicted support point to end at 1896, down
21.89. A lot of the NAS’s relative strength had to do with good relative
support in the semiconductor group. It’s a good sign for bulls that the NAS is
performing better than the Dow and that within the NAS the semis are leading the
market.Â
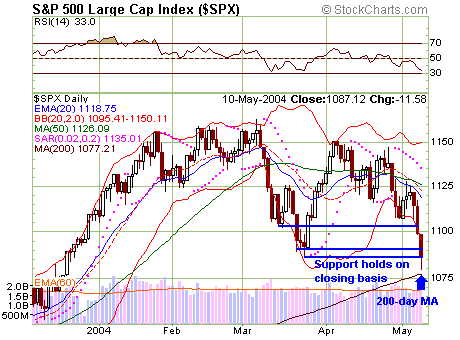
Like the NAS, the S+P closed just above our
predicted support level, ending the day at 1087, down 11.58. Note that the S+P
is still trading above its 200-day MA.
^next^
Prediction for Tuesday: I said
the markets would likely bounce higher Tuesday. The question is: will that
bounce hold? Have we found a bottom?
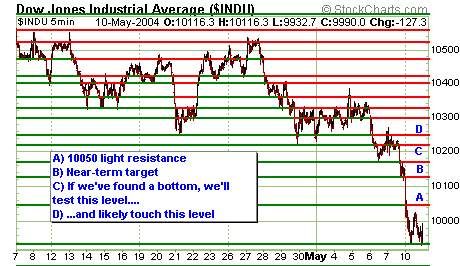
If the Dow can hold above 10000 today I think at
least on a temporary basis we’ve found a bottom. I’d like to see the Dow climb
past 10050. If that level holds, we could see a test of 10170 and then
potentially a more significant test near 10220-50. On the downside, a close
under 10000 and the 200-day moving average could indicate a more pronounced move
lower and a likely re-test and break of the 9950 level.Â
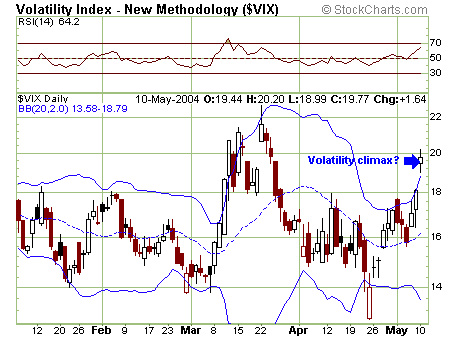
It’s interesting to watch volatility. Yesterday
the VIX index was flashing almost panic level volatility — sometimes the sign
of a potential market bottom. When volatility increases, the premium value in
our options increases. In other words, that’s not good for profits on our short
options portfolio. I think volatility has hit a short term top and I expect
that volatility will ultimately fill the gap it created and move back down to
the 16 level. When Vol moves near the 14 level it will represent too much
complacency in the market and will likely issue a sell signal.Â
Longer Term Market View:Â Ever
since the 10400 top was predicted and a move to our 10000 target was forecast,
I’ve received a number of comments from members along the lines of: “Great
earnings, historic low rates, why is this market sliding?” The answer to this
question provides clues as to where we are headed.Â
Great earnings and historic low rates are
behind us. That’s critical, because markets look forward, not
backwards. The past few weeks the markets are looking seven or so months out —
past the election — and here’s one thing the markets see:Â
There has been an amazing amount of government
spending running up to this election that’s going to come to an end. Yep, the
pump has been artificially primed for an election. We’ve been partying on
borrowed time to elect a conservative president who is in fact such a spender
that he makes fellow big spenders Ted Kennedy and my wife proud. The problem is
that after the election is over it’s time to pay the piper, like a generous
Christmas season on credit cards. This is where the rubber meets road.Â
Chairman Greenspan has already mentioned in uncommonly clear language that he is
concerned about the deficit and current spending. Rightfully so, because here’s
the punch line: the economy might not be looking great after the election, and
it may be mired in a somewhat inflationary environment. That paints chairman
Greenspan and his merry men in a difficult and restricting corner. This is what
the markets are starting to see. If there is any silver lining to any of this,
its that Greenspan isn’t going to be as quick to pull the rate raising trigger
because after this election the economy might not be looking so rosy. This is
one reason I think the Fed is not going to raise rates as fast and as far as the
markets have predicted – and this could provide support in stocks.
Having said this, I think the above information
is now priced into the market… it is in fact behind us. I think the
market has found a bottom for now and will likely move back to higher levels —
but above is one reason there is a lid on this market.
Portfolio Strategy: Right now we
are delta positive. If we clear and hold 10000 we will get additionally
positive and likely look to remain positive until we reach our 10170 initial
target.Â
Yesterday’s results and current portfolio
strategy:
Daily Profit: $20
Â
10100 May Mini Dow Put Options: We are short 2 put options. Yesterday this
option settled at 205, up 70. Loss yesterday with this position was $700.Â
Â
10100 June Mini Dow Put Option: We are short 2 put options. Yesterday it closed
at 295, up 75. Loss yesterday with this position was $750.
Â
10600 May Mini Dow Call Options: We are short 2 put options. Yesterday this
option settled at 2, down 1. Profit yesterday with this position was $10.Â
Â
10600 June Mini Dow Call Option: We are short two call options. Yesterday it
closed at 17, down 18. Profit yesterday with this position was $180.
Mini Dow Futures: We came into the day short two
mini Dow futures. Yesterday it settled at 9952, down 128. Profit yesterday on
this position was $1,280. We are short two mini-Dow.Â
Approximate margin required to trade this
portfolio: $7,315
Delta: +44.75
Gamma: -43.25
Â
Trading Method:Â Mark Melin strategically short
sells options and then directionally trades within this short options portfolio,
always hedging one position against another to generate consistent profits.
Â
For questions and comments send an e-mail to
subscriptions@dowoptionstrader.com
DISCLAIMER:
Past performance is not necessarily indicative of future results.
There is a substantial risk of loss in commodity futures and options
trading. It is not suitable for all investors. Only you can determine
whether this trading suits your particular needs and risk tolerance.
All profit and loss representations are hypothetical and based on the real
time signals generated by The Dow Trader. The results have not been
adjusted to reflect slippage or commission charges. No representation is
being made that any account will or is likely to achieve profits or losses
similar to those shown.
