Volatility Is On Your Side — Use It
What Tuesday’s Action Tells You
Monday’s volume ratio of 18 and breadth prevailed
over the last half-hour mark-up into the close and above the midpoint for the
SPX
(
$SPX.X |
Quote |
Chart |
News |
PowerRating), as it was a trend-down day yesterday after the early gap
up opening. The
(
QQQ |
Quote |
Chart |
News |
PowerRating)s made their intraday high of 34.97 right at the declining
240 EMA on just the 9:35 a.m. ET bar, then headed south below Monday’s low to
an intraday low of 33.84, closing at 33.84, -2.4%, on volume of 105 million.
The SPX made its intraday high of 1048.77 on the 9:55 a.m. bar, re-crossed both
the 20-day EMA and 240 EMA to the downside and then it was trend down to the
intraday low of 1034, closing at 1034.15, -0.9% on the day. The Dow
(
$INDU |
Quote |
Chart |
News |
PowerRating),
after hitting a 9750 intraday high, re-crossed the 50-day EMA of 9645, hitting
a 9622 intraday low, closing at 9624, -0.9%.
| size=2> |
Wednesday
11/12 |
Thursday
11/13 |
Friday
11/14 |
Monday
11/17 |
Tuesday
11/18 |
| color=#0000ff>Index | |||||
| color=#0000ff>SPX | |||||
| color=#0000ff>High |
1059.10
|
1059.62
|
1063.65
|
1050.35
|
1048.77
|
| color=#0000ff>Low |
1046.57
|
1052.96
|
1048.11
|
1035.28
|
1034
|
| color=#0000ff>Close |
1058.53
|
1058.41
|
1050.35
|
1043.63
|
1034.15
|
| color=#0000ff>% |
+1.1
|
0
|
-0.8
|
-0.6
|
-0.9
|
| color=#0000ff>Range |
12.5
|
6.7
|
15.5
|
15.1
|
14.8
|
| color=#0000ff>% Range |
95
|
81
|
14
|
55
|
1
|
| color=#0000ff>INDU |
9849
|
9838
|
9769
|
9711
|
9624
|
| color=#0000ff>% |
+1.1
|
-0.1
|
-0.7
|
-0.6
|
-0.9
|
| color=#0000ff>NASDAQ |
1973
|
1967
|
1930
|
1910
|
1882
|
| color=#0000ff>% |
+2.2
|
-0.3
|
-1.9
|
-1.1
|
-1.5
|
| color=#0000ff>QQQ |
35.84
|
35.78
|
35.03
|
34.65
|
33.84
|
| color=#0000ff>% |
+2.2
|
-.08
|
-2.1
|
-1.1
|
-2.3
|
| color=#0000ff>NYSE | |||||
| color=#0000ff>T. VOL |
1.33
|
1.36
|
1.34
|
1.33
|
1.31
|
| color=#0000ff>U. VOL |
1.10
|
689
|
455
|
236
|
392
|
| color=#0000ff>D. VOL |
205
|
655
|
871
|
1.06
|
911
|
| color=#0000ff>VR |
84
|
51
|
34
|
18
|
30
|
| color=#0000ff>4 MA |
50
|
50
|
51
|
47
|
33
|
| color=#0000ff>5 RSI |
65
|
65
|
46
|
36
|
25
|
| color=#0000ff>ADV |
2454
|
1861
|
1344
|
976
|
1358
|
| color=#0000ff>DEC |
814
|
1394
|
1884
|
2276
|
1907
|
| color=#0000ff>A-D |
+1640
|
+467
|
-540
|
-1300
|
-549
|
| color=#0000ff>4 MA |
+90
|
+204
|
+240
|
+67
|
-480
|
| color=#0000ff>SECTORS |
-3.4
|
||||
| color=#0000ff>SMH |
+3.6
|
-2.0
|
-1.1
|
-1.0
|
-1.6
|
| color=#0000ff>BKX |
+0.3
|
-0.1
|
-4.1
|
-0.3
|
-1.2
|
| color=#0000ff>XBD |
+1.1
|
+0.1
|
-0.6
|
-1.8
|
-1.2
|
| color=#0000ff>RTH |
+0.3
|
-1.6
|
-0.9
|
-1.0
|
-0.7
|
| color=#0000ff>CYC |
+1.4
|
-.03
|
+1.9
|
-1.0
|
-0.8
|
| color=#0000ff>PPH |
+1.8
|
+2.9
|
+6.2
|
-0.6
|
+0.2
|
| color=#0000ff>OIH |
+0.6
|
+2.0
|
+0.5
|
-1.9
|
-0.6
|
| color=#0000ff>BBH |
+2.3
|
+1.4
|
-2.0
|
+0.9
|
-1.9
|
| color=#0000ff>TLT |
+0.7
|
+1.6
|
+0.7
|
+0.2
|
+0.7
|
| color=#0000ff>XAU |
+5.6
|
-0.6
|
+0.9
|
-2.1
|
+4.6
|
NYSE volume was 1.31 billion with a volume ratio
of 30 and now into the short-term oversold zone with a four-day MA of 33 and
a three-day MA of 27. Breadth was only -549 yesterday, and the four-day MA is
negative at -480. The SPX five-day RSI is 25, down from 36 yesterday, while
the QQQ RSI is 20, both the Nasdaq and Dow at 23 and the SMHs 29, so the dynamics
have just entered a zone of attention for short-term traders. As you can see
on the table, the range for the SPX has expanded the last three days, as volatility
is obviously expanding.
For Active
Traders
Traders caught the intraday high zone
yesterday
if you took the short entry on a re-cross of the 20-day EMA of 1047.52, as
the
SPX went trend down all day, hitting an intraday low of 1034, closing at
1034.15, -0.9%. This
Trap Door contra move also re-crossed the 240 EMA and
.50
retracement to 1063.65 as it traded below the 20-day EMA. This certainly was
enough confluence to take the trade, in addition to the fact that short
entry
was also in the 1044 – 1048 60-minute-chart resistance mentioned in
yesterday’s
commentary. The SPX traded down to the 60 EMA after re-crossing the 20-day
EMA,
hitting 1042.61, then resumed the direction of the open, but failed at
1046.55
and then it was trend down to that 1034 intraday low. The SMHs gave you a
similar trade as it re-crossed the 240 EMA around 42.45 after the gap up
opening, trading down to a 41.18 intraday low, closing at 41.22, -1.6%.
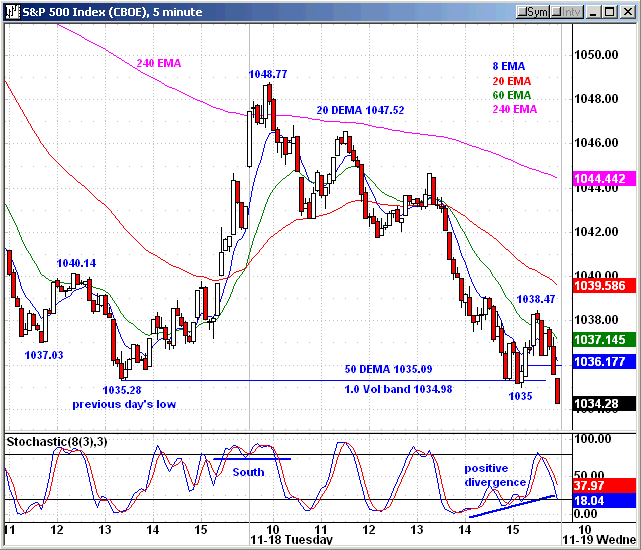
The SPX took out the previous day’s low of
1035.28 on the 3:10 p.m. bar, then reversed it to the upside. By taking out
the
previous day’s 1035.28 low, it set up the RST long entry above 1036 with
entry
on the 3:15 p.m. bar. This RST was in confluence with the 50-day EMA of
1035.09,
the 1.0 volatility band of 1034.98 and a positive divergence in the 8,3,3
slow
stochastic indicator. I have included this five-minute SPX chart in today’s
commentary and labeled the other four RST swing points to the left of the
1035
RST signal bar swing point low. The E-mini RST entry was also at the 1036
level.
This trade was not to be, as the SPX just hit
1038.47, then turned down after four bars to a new intraday low of 1034,
closing
at 1034.15. You scratched the trade no worse than breakeven. There was a
good
take, but no result, and that’s why they call it trading.
Today’s
Action
I am doing this Tuesday night for Wednesday,
so I
don’t know if the closing weakness and early futures will generate an early
down
opening, but most of you know the drill if that happens by utilizing the
First
Hour strategies in conjunction with the volatility bands and standard
deviation
levels. The SPY close of 103.85 is at the one-month 2.0 standard deviation
band
with the 3.0 standard deviation down at 103. The 20-day 30-minute numbers
are
about the same.
The QQQs, led down by many of the funny money
stocks that have had extraordinary runs, closed at 33.84, below the 2.0
standard
deviation band of 34.25 and just above the 3.0 band at about 33.60. (Keep in
mind
these bands change dynamically each day as price changes and should be
on
your screens with live data.)
The SPX closed just below its 50-day EMA of
1035.08, but if there is more weakness, we look to the 89-day EMA down
around
1019 where the last swing point retracement was 1018.32. The Sept. 30
retracement made it to the 89-day EMA zone around 990, then re-crossed the
50-day EMA, which was 1015 at the time and that was also the upper boundary
level of that longer trading range from June 17 to the breakout on Sept.
2.
The major indices are three red days down on
expanding range and not a significant increase in volume yet, so daytraders
should be prepared for any reflex up on Wednesday. Keep in mind that this is
an
air pocket, not a real retracement yet, as the SPX is only down -2.8%
high-to-low, as is the Dow. The QQQs are -5.9% and SMHs -7.8%. The SPX
retracements so far have been in the 4.5% – 5.5% range, and a 5.0%
retracement
takes the SPX down to the 1010 – 1005 level. Daytraders, make hay because
the
volatility is on our side now.
Have a good trading day,
Kevin Haggerty
src=”https://tradingmarkets.com/media/2003/Haggerty/kh111903-01.gif”
width=”381″ height=”326″>
src=”https://tradingmarkets.com/media/2003/Haggerty/kh111903-02.gif”
width=”382″ height=”327″>