A Technique For Trapping Pullbacks
Trends
are a good thing. But chasing
trends can sometimes lead to buying the high tick or selling the low tick —
not a good thing. Thus one approach that
many traders gravitate toward is that of buying dips in an uptrend and selling
rallies in a downtrend. This practice,
which has withstood the test of time, is referred to generically as buying or
selling a pullback.
In this lesson I’ll show you
a simple mechanical method for qualifying pullbacks.
The Stoch-Trap is not a mechanical
trading system, nor does it generate strict buy and sell signals.
Like other technical patterns, its function is to isolate specific
recurring conditions in price action. If
you test this method on a mechanical basis, there is a slight positive
statistical edge, but not one you might trade blindly.
Its real edge comes from putting you in sync with the market’s
short-term cyclical movements. Combined
with proper risk and money management techniques, the Stoch-Trap can be a
powerful tool and is one I have used successfully in my own trading.
Some background.
When I first got involved in technical trading, I was fascinated by
pullback strategies. I felt like I had
discovered a sneaky method of following the trend while still getting in “on
the cheap.” One of the first methods
I learned in this regard was the 3/10 MACD oscillator method popularized by
trader Linda Raschke. I also explored
many other methods for identifying pullbacks. After
pouring through dozens of different oscillators, chart patterns and parameter
sets, I came to the conclusion that the best short-term cycle indicator was the
four-period Stochastic %K line. Most
charting packages plot the Stochastic indicator using two lines: %K and %D.
The %K line is the faster of the two lines and is the only one I look at.
Of all the indicators I studied, none had the ability to highlight short-term
overbought and oversold levels as consistently or as clearly as this indicator.
The Stoch-Trap setup uses the
four-period Stochastic %K in combination with a second indicator for
establishing the longer time frame trend, such as a 50-period simple moving
average or the 5/35 MACD. I will
illustrate the setup using both of these indicators.
A
Stoch-Trap BUY setup occurs when: the
four-period Stochastic %K is less than 21 and the close is above the 50-day
simple moving average, or the 5/35 MACD is greater than zero (positive).
Conversely, a Stoch-Trap SELL setup
occurs when the four-period Stochastic %K is greater than 79 and the close is
below the 50-day simple moving average, or the 5/35 MACD is less than zero
(negative).
Following a Stoch-Trap setup, I
look to enter the trade after the first 30 to 60 minutes of the day, after the
market has made its morning low or high, on a breakout of the morning range.
The best trades occur when the market gaps up or down slightly against
the longer-term trend (a very large gap is something you do not want to fade) or
opens near the previous day’s closing price. The
rationale here is that the market is short-term oversold within the context of a
larger time frame trend, thus a slight gap down (for buys) or up (for sells)
merely pushes the market that much closer to its ultimate short-term bottom or
top before resuming its main trend.
Let’s begin by showing a few
examples of the Stoch-Trap in action.
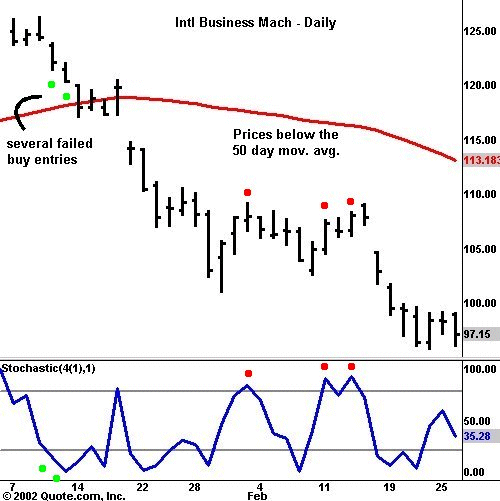
In this chart, we see International
Business Machine (IBM) has the conditions for a Stoch-Trap sell in
mid-February. The stochastic is above 79,
and the price close is below the 50-day moving average.
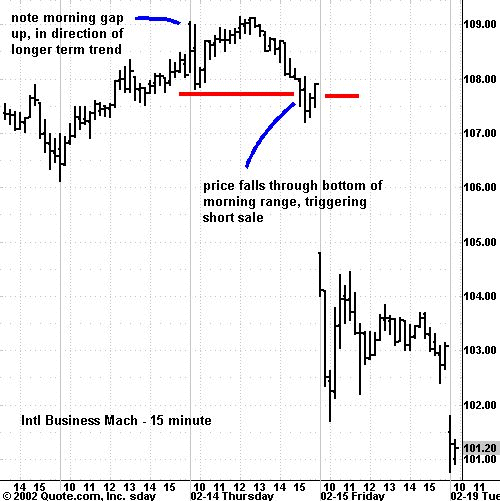
The next morning, IBM gaps slightly higher and then forms a trading range
for most of the day. When IBM breaks down
through the morning low, at 107.80, a short trade is entered.
The next day, IBM gaps lower more than three dollars and proceeds to sell
off over ten dollars the next several days.
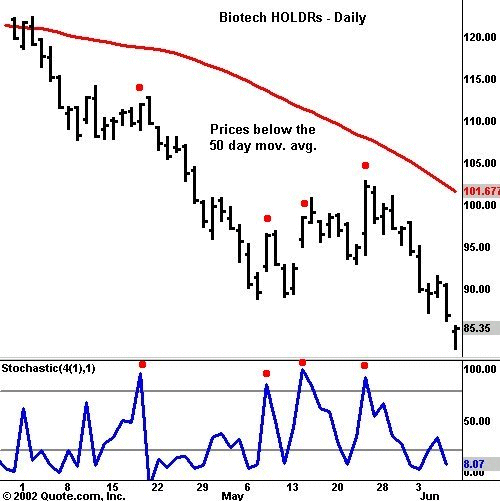
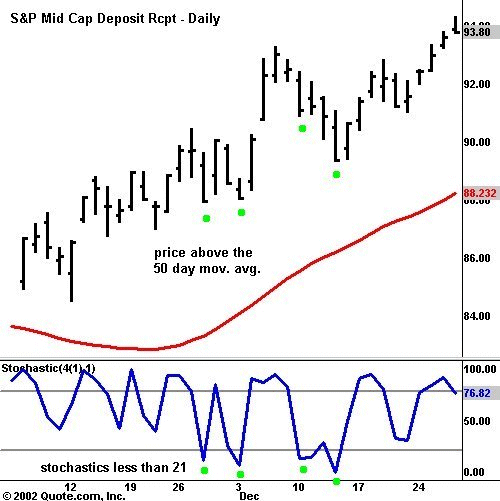
I’ve selected charts of the Biotech
(BBH) and S&P Mid-Cap (MDY) exchange
traded funds to demonstrate other examples of the Stoch-Trap pattern.
Green dots represent long setups, and
red dots represent short setups.
As you can see from these examples, the method is not a panacea.
In early December of last year, the S&P Mid-Cap signaled a failed
long entry. However, two days later,
another long Stoch-Trap signal kicked in again, giving a good trade.
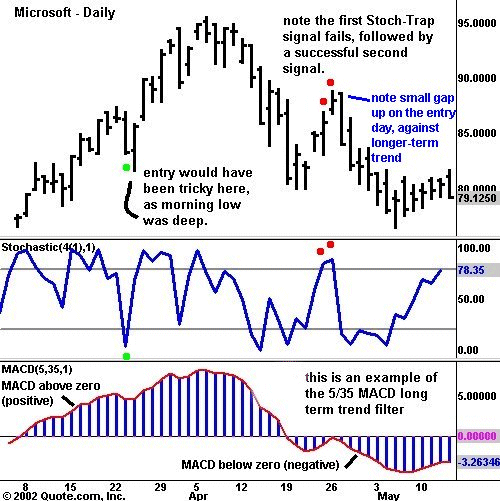
In the last chart of Microsoft (MSFT),
I show an example of how to use the 5/35 MACD as a trend filter, rather than the
50-day moving average.
Once a trade has been entered,
I like to keep the initial stop in place for one to two days in order to give
the trade room to develop. If after two
days the market has moved in the direction of the trade and shows a profit, I
will then tighten the stop up to the high or low of the current bar.The Stoch-Trap method
highlights short-term cycle highs and lows that might otherwise go unnoticed by
visual inspection alone, while helping us trade in the direction of the
longer-term trend. The essence of any
pullback strategy is to find spots where the price does not spend much time
“hanging around.” Price is here
today and gone tomorrow, or if we’re very fortunate, gone in the next five
minutes.
Again, the Stoch-Trap is not a
strict mechanical system. Like any
discretionary pattern or setup, it takes some studying and practice in order to
separate the trades with the greatest potential for success from the marginal
candidates. For example, when prices are
very close to crossing over from one side of the moving average to the other, or
when the MACD is very close to zero rather than distinctly above or below zero,
we know the market is nearing a trend change. At
these points a greater degree of judgment is necessary before entering the
trade. Also, after the market has made
multi-week climax lows or highs, we want to be aware of the potential for “V”
bottoms or tops and avoid fading the first reactions from these points.
A trend change will not always be signaled early enough to keep us out of
these situations. Although I have shown
you only daily charts, I also find this pattern works well on weekly and
intraday charts.
For The Best Trading
Books, Video Courses and Software To Improve Your Trading
