Here’s What I’m Looking For If They Shake The Tree
Friday
was the third day down in succession for the major indices,
all with closes in the bottom of the
range, and also closes in the bottom of the range on a weekly outside reversal
bar. NYSE volume was light for an option expiration Friday at 1.35 billion, the
volume ratio 24 for a three-day moving average of 31, and breadth -1047 for a
three-day moving average of -500. The range on the
(
SPY |
Quote |
Chart |
News |
PowerRating)s expanded to 2.15
points, yet volume declined to 36 million from the 45 million on Thursday which
tells you the buyers were on vacation Friday. The SPX
(
$SPX.X |
Quote |
Chart |
News |
PowerRating) and Dow
(
$INDU |
Quote |
Chart |
News |
PowerRating) each lost about 1.4%, while the Nasdaq
(
$COMPQ |
Quote |
Chart |
News |
PowerRating) declined
3.3% and the NDX
(
$NDX.X |
Quote |
Chart |
News |
PowerRating) was -4.4% as the techs got whacked, led by the
semis, with the
(
SMH |
Quote |
Chart |
News |
PowerRating)s down 5.3% riding the Intel
(
INTC |
Quote |
Chart |
News |
PowerRating) company
outlook fallout.
This rally for the major
indices ended at the .786 retracement to the Dec. 2 highs and in the very strong
time zone which you were alerted to well in advance. If the Dec. 31 lows are
taken out, then you must be aware of the framework where the next decent move
might start from. This is a very real possibility now, as the 60-minute RSI for
the major indices is oversold, but certainly not the weekly and daily. That
being said, it is now possible for a further retracement to the October lows.
For the Dow, who’s
retracement low so far is 8243, that means the .50 retracement at 8120 and the
.618 at 7908. 8069 is the level where the current leg down would equal the first
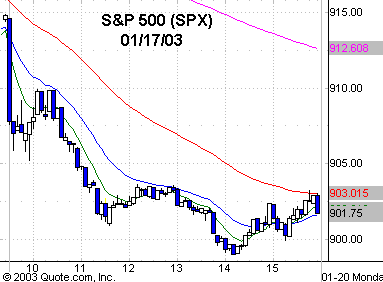
leg down from the Dec. 2 high, or AB = CD. For the SPX which closed at 901.75,
if it breaks 869.45, it has the .50 retracement at 861 and the .618 at 840. AB =
CD at 850 and the 1.27 Fib extension of the last leg up is 851.70. The Nasdaq
closed at 1376, and the Dec. 31 low was 1327.19. The .50 retracement is 1315.50,
and the .618 is 1267. AB = CD at 1273, along with the three-month 3.0 standard
deviation band at 1275 as of Friday. All three major indices had weekly outside
reversal bars, as I mentioned above, with the Dow’s low at 8559, having closed
at 8586.40. For the SPX, it is 899 and the Nasdaq 1376.
With the weekly lows as a
magnet, and after three straight down days, they can take out those weekly lows
today, shaking the tree for sure, and then reverse on a reflex rally to some
measurement of the current decline from the 1,2,3 lower top. I would rather sell
a retracement short, than the first entry below last week’s lows. I am talking
intraday trades. I would look for a quick upside intraday trade if they shake
the tree first, and then reverse them.
The next interesting long
major index position trade for me doesn’t happen unless the major indices take
out the Dec. 31 lows, retrace further to the October lows, and we have an
oversold condition at the extended standard deviation bands.
If Saddam goes into
exile, then the seven-month inverted head-and-shoulder pattern probably gets
taken out to the upside immediately, and the
(
TLT |
Quote |
Chart |
News |
PowerRating)s,
(
IEF |
Quote |
Chart |
News |
PowerRating)s and
(
LQD |
Quote |
Chart |
News |
PowerRating)s, which are the bond proxies, sell off. Until either of these things
happen, it is trading range tactics for the major indices, and that’s fine for
daytrading, but not for making a major directional bet because there isn’t a
significant edge right now. That is why I put a delta neutral position trade on
into the 1,2,3 lower top. Volatility had declined, and I wanted to be in
position for exile news or new retracement lows in case of war. If I don’t get
any volatility and the major indices stay in this trading range, then I will eat
some time decay premium, but that’s not the case so far after the three-day
decline and the increase in volatility.
Have a good trading day.

Five-minute chart of
Friday’s SPX with 8-, 20-,
60- and 260-period
EMAs

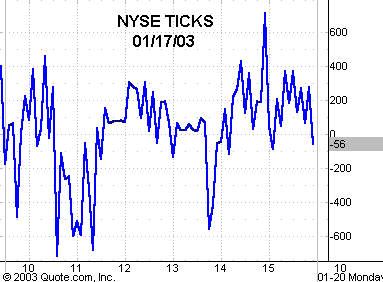
Five-minute chart of
Friday’s NYSE TICKS
