Why You Should Trade Gartleys…
About two months ago we were
looking for short opportunities off of a bearish pattern against
Fibonacci price resistance on this daily chart of Krispy Kreme
(
KKD |
Quote |
Chart |
News |
PowerRating). Well,
two months and 10 points lower, that trade worked out quite well, and now we are
looking for a long trade in this sweet thang.
Â
As I type, my mouth is watering thinking about those
original glazed doughy discs from heaven. Yeah, can you tell I’m on a health
kick. Cardio 3x per week and Weights 3x per week. I eat healthy six days a week
and each Saturday I have what is called a “free day.†It’s all about the free
day, baby! Tomorrow morning I’ll wake up, walk into the kitchen and declare my
independence from health for 24 hours. I can guarantee you one of the
“unauthorized foods†that will be going down the chute first thing is one of
those Krispy Kreme doughnuts.
Â
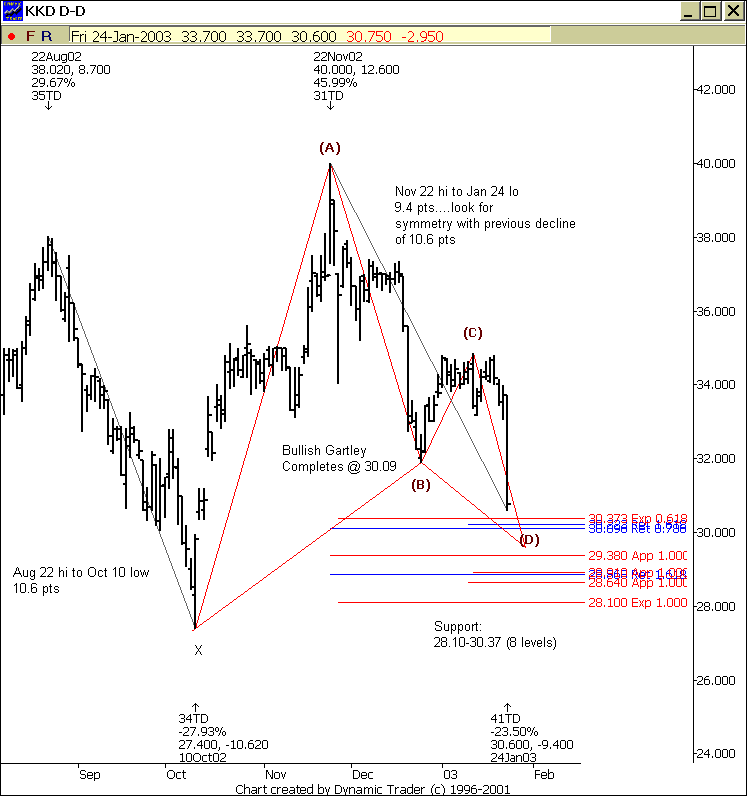
Until then, let’s talk about a possible long setup in this
stock. We have a number of items I look for coming into confluence:
Â
1)Â Â Â Â Â
Pattern: A Bullish Gartley pattern that completes @ 30.09.
2)Â Â Â Â Â
Fib Price Support: I have 8 price levels acting as support at this
zone.
3)Â Â Â Â Â
Symmetry: The previous major decline was 10.6 pts. This decline
from the Nov. 22 high is at 9.4 points. Look for price symmetry to key a
possible reversal.
Â
So, I’ll be looking for a trigger to take this long. If
triggered in, my stop will be just under the support zone. The flipside to this
is if price just keeps dropping without a trigger and goes through our zone. At
that point, I’ll trash the long setup and be looking to short any rallies into
Fibonacci price resistance zones.
Â
Good Health To Ya!
Â

