Here’s What The Generals Look At
The
SPX
(
$SPX.X |
Quote |
Chart |
News |
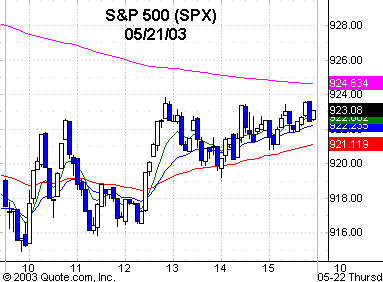
PowerRating) carried through on the early red futures
and traded down to 914.91, which was the signal bar (9:50 a.m. ET) for both a
Trap Door and 1,2,3 higher bottom entry above 915.65. 914.91 proved to be the
intraday low and had some confluence. (See yesterday’s commentary.) It was a
choppy day, as the SPX and Dow
(
$INDU |
Quote |
Chart |
News |
PowerRating) were up +0.4% and +0.3%, while the
Nasdaq
(
$COMPQ |
Quote |
Chart |
News |
PowerRating) lost just a point and the
(
QQQ |
Quote |
Chart |
News |
PowerRating)s was -0.2%, as was
the
(
SMH |
Quote |
Chart |
News |
PowerRating).
Oil service stocks made a
strong move at +4.5% on a wide-range-bar day, closing above the 12-month EMA for
the first time since May 2 of last year. The move had volume, as you can see on
today’s
major index and
3-day Wake Up Call screens. Natural gas, which is the XNG, was +2.7%, the
XAU was +1.7%, while the financials also gained, with the XBD +1.5% and BKX
+0.6%. It was a very, very mixed day. I want to see the semis, brokers and the
CYC or XLB all move in tandem, as that tells the story of positive perception by
the Generals.
The SPX closed at 923.42,
right at the 12-month EMA and in a closing-range ascending triangle, with the
top at 923.60. The closing range and/or pattern is your first entry in your
daily trading plan, as it often leads to early entry on stocks that had setups
on the daily chart with the breakout pattern entry above the high or low. When
you want to take some noise off the daily hype and every daily jiggle of the
major indices, just go to your weekly charts and get a grip on yourself. You
will have a much clearer view of what your next move will be and at what level.
Take the QQQs for
example. After four straight weeks up with higher highs and lows, this is the
first week going the other way so far. The QQQs closed at 27.71, right on the
12-month EMA yesterday. Looking at the weekly chart with five-, 15- and 40-week
EMAs on it, you will clearly see where you get interested again and be ready to
play any intraday setups that have position potential.
Spend some time going
through the monthly and weekly charts and see how various sectors have behaved
in bull and bear markets, and what they look like now. The Generals look at
price patterns on both absolute strength and relative to the S&P 500. You can
too. They certainly look at relative momentum, and on a monthly chart, that
could be simply a 12-month EMA of price and 12-month rate of change. For
example, view the 10-year monthly chart of
(
MSFT |
Quote |
Chart |
News |
PowerRating), and you will see the
significant divergence of price and the 12-month rate of change at the top.
Sometimes it is neutral and tells you nothing. But when defensive sectors start
to roll over and sectors like technology start to roll under and turn up, you
can rest assured that the Generals are at work and their perception of a
potential market change has gotten positive.
They, of course, are
always measuring any relative valuation fundamental parameters to gauge just how
over- or undervalued a group is to the market. They also factor in various
economic variables with different sectors. We as traders can’t expect to do
that, nor would we want to, but with some extra effort, you can get very
cognizant of the relative price patterns and relative momentum and have a good
feel of the sector rotation, and whether the Generals perceive it to be a
defensive sector market or whether they are betting on the up, or recovery,
market. If you are any kind of position trader, it is imperative that you do
this.
This is a holiday
weekend, so trading will be slow and/or erratic. If it is, just turn off the
empty suits and switch to the Colonial golf tournament and watch Annika play
with the big boys. This corner is sure rooting for her. She stepped up to the
plate. She would probably make a great trader.
Have a good trading day.

Five-minute chart of
Wednesday’s SPX with 8-, 20-,
60- and 260-period
EMAs

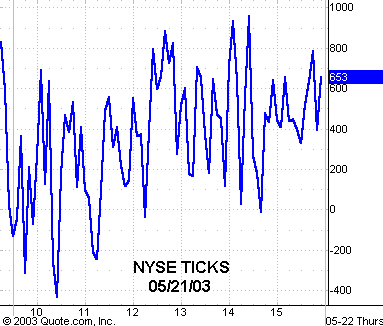
Five-minute chart of
Wednesday’s NYSE TICKS
