Two Reasons This S&P Level Is Critical
While
I normally try to keep the market analysis short, and focus on
trading ideas, I noticed a few things today that I thought should be pointed
out. First, the major indices all
finished well off their intraday highs today, while volume came in heavy. While
they were up, it was by fairly marginal amounts.
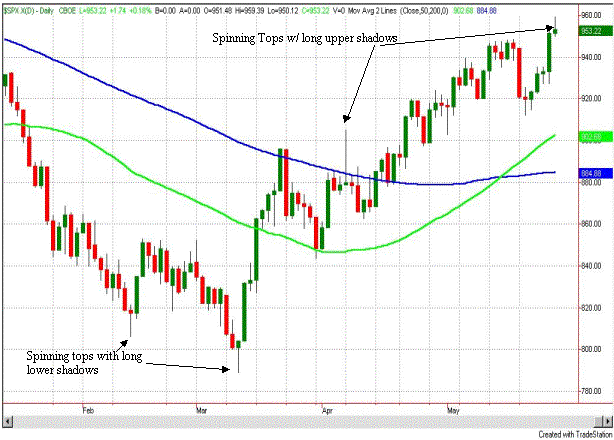
A graphical depiction of the S&P 500 is shown on the daily chart
below.Â

You’ll notice that today’s
candle had a small real body, and a large upper shadow.
A candle with a small real body is referred to as a “spinning top.â€
It is especially significant after a sharp run-up (or decline).
It means that the bullish momentum is losing steam, and is a cautionary
sign that the rally may be stalling. The
large upper shadow on today’s candlestick is another cautionary sign. What this indicates is
that the market may be beginning its next pullback, or consolidation.
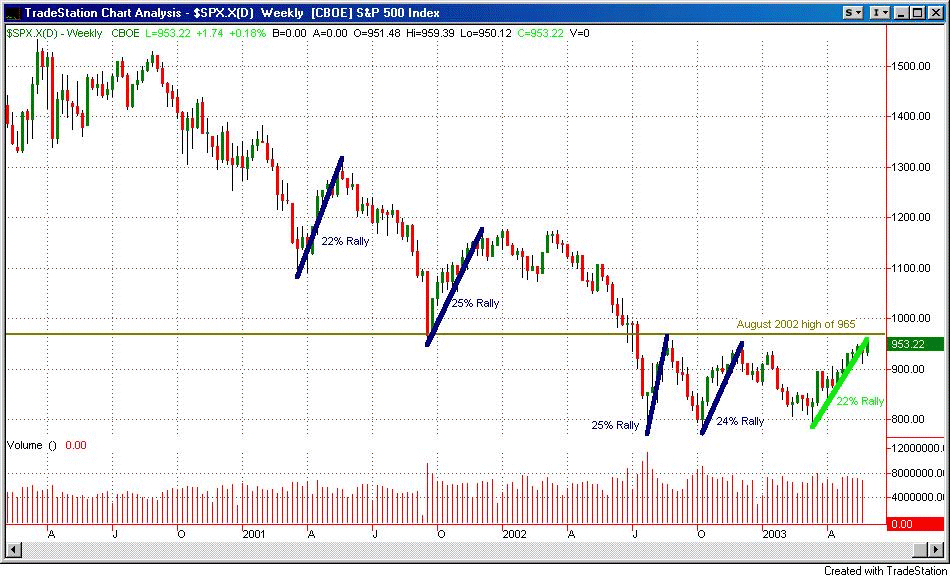
Of further significance, we are
now approaching a critical area on the weekly chart.
The chart below goes back to the March 2000 highs.Â

As you can see, we are now
experiencing the fifth rally of 20% or more since the market topped.
(For those people on CNBC that consider a move upwards of 20% in the
major indices to be a bull market, we are now in the fifth bull market in the
last 2 ½ years. For those of you
in the real world…that 20% definition is bull crap.) We had two such rallies
in 2001, two more in 2002, and now we are experiencing the first one in 2003.
The reasons I feel this area is
critical on the weekly chart are as follows:
-
First, you’ll notice that
the percentage we’ve climbed off of the March lows is within the range of
where the other rallies stalled out (22%-25%).Â
-
Second, the price
resistance level of 965, which was the August 2002 highs, is very close by.
So do I think the rally is
ending? In fact I believe
this rally has a good chance of far exceeding the previous rallies I marked on
the chart (percentage wise). Just by
looking at the lines I’ve drawn you can see that it’s different.
(It’s green, and they’re blue — but that’s not what I’m getting
at.) The angle of the trendline is
flatter. The other rallies were pretty
much straight shots. With this
rally, we’ve had several successful pullbacks.
This is much healthier action. I’ve
also noticed that leading stocks have acted better, and breadth has been much
improved in this rally, as compared to the other four.Â
Sentiment has not been good, but the UUWNHI is still saying to buy
pullbacks and breakouts.
So while I believe we are about
to begin a pullback/consolidation over the short term, the long-term picture
could turn very positive if we can manage to get through this resistance area.
I do not see any significant resistance after this until you get
to around 1050 on the S&P. So let’s
all cross our fingers and hope for an orderly correction, followed by a strong
move through resistance. We don’t want
this one to turn out like the rest.
Best of luck with your trading,
Â
