How To Spend Your Day If You’re A Trader
What Thursday’s Action Tells You
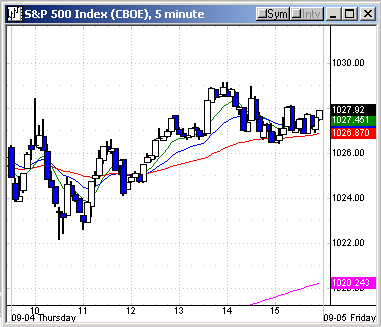
The major indices drew a line for a second day as
the SPX was virtually unchanged at 1027.97, +0.2%, as was the Dow, which closed
at 9588. The Nasdaq, 1869, and QQQ, 34.15, were both +0.9%. NYSE volume dropped
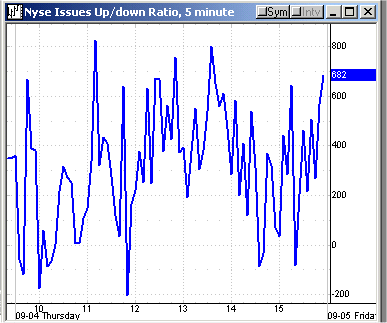
to 1.35 billion, volume ratio neutral at 54, as you might expect with the two
days of sideways trading. Breadth was also neutral at just +319.
In the major sectors, the SMHs were +1.9% and
reversed most of the previous day’s loss as
KLAC was +2.4% versus the previous day -3.2% loss. NSM was run up +11% on better
earnings news but also flat revenue; yet an optimistic forecast. Here we
go again. Deja vu. Teradyne was +7.2%.
The BBHs ended +1.4%, but after that
the BKX, CYC, PPH and OIH all closed red, while the XBD was +0.4% and RTH
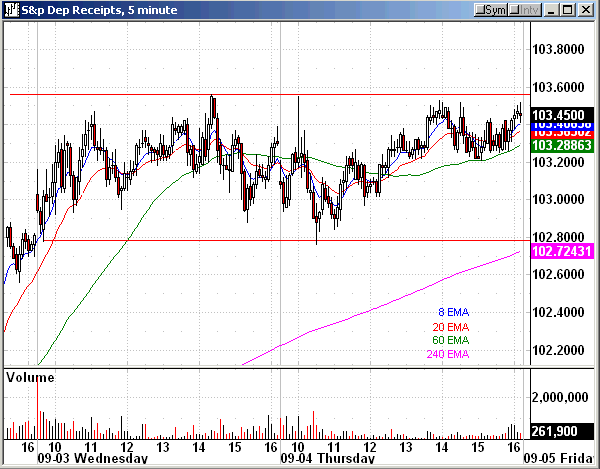
+0.3%. The SPY chart in today’s commentary highlights the 2-day range which will
get resolved quickly with the economic report today. If you want to read about
the inadequacies of the jobs claims and government statistics in general, go to
the New York Post website and look for
John
Crudele’s archives. He’s one of the few financial media types I know who
gives you some facts and doesn’t seem to have a political axe to grind.
For Active Traders
With the sideways action the last few days,
futures and index proxy traders haven’t had any real good opportunities other
than a few scalps and probes as nothing carried through. This is not unusual as
major indices adjust to the new levels. The SMH and/or related individual stocks
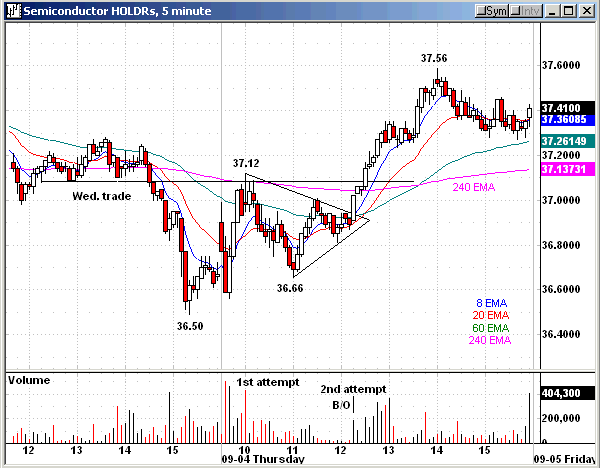
continue to provide the better action. I have also included the SMH 5-minute
chart today, which highlights the previous day’s short side trade below the
neckline down to 36.50. Yesterday the SMH retraced to 36.58, below the previous
close of 36.70, then rallied back to 37.12, Wednesday’s neckline/resistance and
also to the 240-EMA, which was a short opportunity depending on your bent. They
declined -1.2% to 36.66, which is the .707 retracement to 36.50. The first
attempt through resistance was on a volume increase and the decline to 36.66 was
on an obvious decline in volume which should get your attention on the
retracement to 36.50. From there, the SMHs broke out of the triangle just below
the neckline on an increase in volume, and then the second attempt through the
240-EMA — which is the key point of this example –Â was successful and on
an obvious volume expansion.
FYI: when the dynamics are strong across the
board and most of the sectors are green, there is no reason not to take a good
first entry, but that wasn’t the case yesterday as the major indices were in
chop mode. For my 1,2,3 strategy veterans, 36.50 was the 1 point, 37.12 was the
2 point, and 36.66 the third point with the correct retracement filter in
addition to the increase in volume on the reversal of the signal bar’s high. If
you just trade the major indices with either futures and/or index proxies, then
you are severely limited in opportunities when there is sideways trading range
action, so if you have adequate capital, look to expand your universe.
Today’s Action
Today there will probably be a futures-induced
reaction to trade, and maybe both ways. The SMHs are now nine days into the
confluence zone from 37.57 to 38.19. There was a quick 2-day decline of over 7%
after the initial 37.86 high on August 22, while the last four trading days
had highs of 37.56, 37.95, 37.73, and yesterday 37.59. You know where the highs
are, and if it gets resolved to the downside then below 36.50 gets it started,
which would be a reversal of the last five days’ lows. The 8-day EMA is 36.73,
while the 20-day EMA is 35.25. The last spike up into the confluence zone put
the momentum indicator into most overbought since this rally leg started from
the February 10, 20.36 low, and put the SMH +30% above its 200-day EMA. Pretty
lofty territory.
All of the analysts are now expert on the semis
again, along with their price objectives. Where were they when we bought them at
worst on that February retracement to 20.36? Correct. Nowhere to be found,
because they just follow price with their emotions as do 90% of the herd.
Spend your day scrolling the intraday charts and let the trades come to you —
don’t force it. We start out this morning with the futures red. Keep in mind we
are entering the short-term cycle down for the SPX.
Have a good trading day,
Kevin Haggerty


Â

