Thursday’s Levels
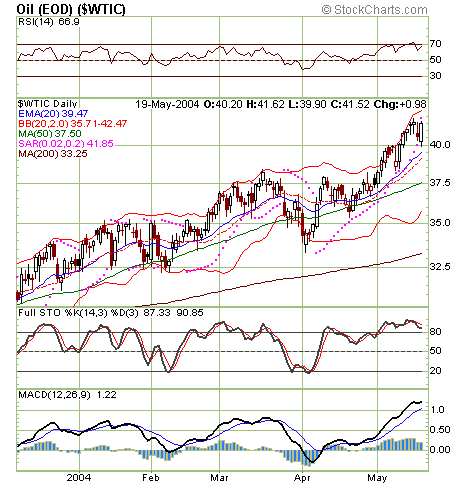
Wednesday Recap: The market had
another wild ride on Wednesday, highlighting the fear and fragility that
underpins stocks. The market started out of the gates higher on the back of
strong overseas buying and lower oil prices. In fact, many of the overseas
markets had completed a bounce of their 200-day moving averages in a similar
fashion to the S+P, which highlighted the strong potential for a global stock
market rally.  Oil started the day lower, touching a low of $40 intraday. This
propelled the move higher in stocks and what looked like a potential precursor
to a global rally.  However, when oil bounced off the $40 support level, stocks
moved lower as oil moved higher. On the day the primary oil index closed just
over $41.50 per barrel.

                            Â
Charts from www.stockcharts.com
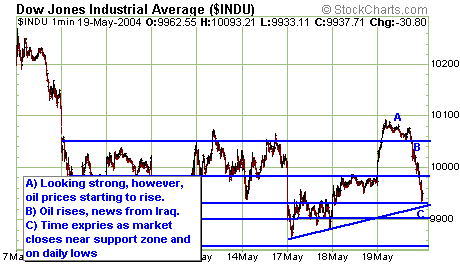
The cash Dow started the day higher, briefly
pausing at the 200-day moving average before powering past the 10050 level and
ultimately reaching a high of 10093. Then as it became evident oil wasn’t
busting under $40, the market stagnated then moved significantly lower in the
afternoon, moving down hard and fast to ultimately close at 9937. While
advancers beat decliners by 5 to 1 on the big board, that is deceptive because
if time hadn’t run out on the clock the AD line – as well as some additionally
critical chart support – might have been broken.Â

^next^
Prediction for Thursday:Â The
market could touch both sides of the flat line today. We’ll watch for a
potential important test of support early in the morning. If this support
holds, we could see a bounce higher. If support holds, for the week I expect
back and forth trading to be contained within a range until options expire.Â
On the cash Dow, we’ll watch a support zone from
9930-9900. If this is broken we could test more significant support, namely on
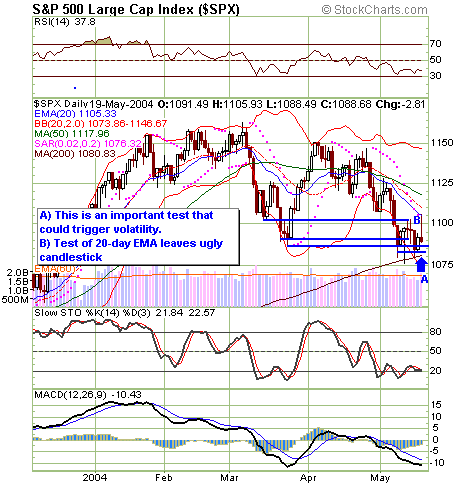
the S+P. As the Dow is testing initial support, we’ll watch the S+P test
support near 1083-85. If this breaks we could see the most important test of
the day: the cash S+P’s 200-day MA. This could break, and if it does we’re
going to see a lot of sell stops executed and the market could get volatile and
somewhat unpredictable.Â
 
Portfolio Strategy:Â Right now
the risk reward ratio on our 10100 June Puts don’t have enough premium in them
to be worth the risk. Early this morning we’re going to exit these puts and see
how the market sets up today. Â
Â
Yesterday’s Results and Current Portfolio
Status:Â Â
Daily Loss: $520
Â
10100 June Mini Dow Put Option: We are short 2 put options. Yesterday it closed
at 275, up 13. Loss yesterday with this position was $130.
Â
10600 May Mini Dow Call Options: We are short 2 put options. Yesterday this
option settled at 1, unchanged. Profit yesterday with this position was $0.Â
Â
10600 June Mini Dow Call Option: We are short two call options. Yesterday it
closed at 5, down 6. Profit yesterday with this position was $60.
Mini Dow Futures: We came into the day short one mini Dow future. We bought
that future back at 10047. Loss yesterday on this position was $450. We are
flat the mini-Dow.Â
Trading Method:Â Mark Melin strategically short
sells options and then directionally trades within this short options portfolio,
always hedging one position against another with the goal of generating
consistent profits.
Â
For questions and comments send an e-mail to
subscriptions@dowoptionstrader.com
DISCLAIMER:
Past performance is not necessarily indicative of future results.
There is a substantial risk of loss in commodity futures and options
trading. It is not suitable for all investors. Only you can determine
whether this trading suits your particular needs and risk tolerance.
All profit and loss representations are hypothetical and based on the real
time signals generated by The Dow Trader. The results have not been
adjusted to reflect slippage or commission charges. No representation is
being made that any account will or is likely to achieve profits or losses
similar to those shown.
