The Surprise You May Be In For
The December S&P 500
futures (SPZ and ESZ) finished slightly lower last week after a mixed
performance by the major indexes. Volume for the week was moderate on a slight
deterioration in market breadth and market players appeared to lack conviction
due to the arrival of earning season. The futures could not make much headway
to the upside despite solid earnings reports from INTC, BAC, and MER, but on the
other hand, the reaction to weak reports from the likes of GE, IBM, NOK, CAT,
and EBAY failed to generate much selling pressure.
The December S&P 500 futures closed Friday’s
session with a loss of -11.50 points and finished the week with a loss of -2.75
points. Volume in the ES was estimated at 608,000 contracts, which was behind
Thursday’s pace, and below the daily average. Open interest declined with the
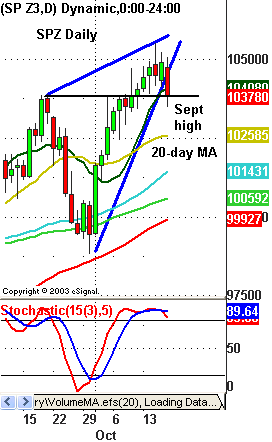
pullback, indicative of mostly long liquidation. On a weekly basis, the
contract posted a gravestone and a market structure high after reversing just
shy of those 2 lines of Fib resistance in the 1,056 area that we’ve been
following. On a daily basis, the rising wedge pattern has broken, along with
10-day MA support. If the contract cracks the September reaction high, where it
settled on Friday, there is an air pocket down to its 20-day MA at 1,026 (see
chart). On an intraday basis, the 60-min chart broke its multi-day uptrend
line, while the 13-min chart closed with a bear flag at 15-MA resistance.

Looking ahead this week, the economic calendar is
virtually empty, aside from the Leading Economic Indicators on Monday and Weekly
Jobless Claims on Thursday, so the market will be earnings-driven.
Expectations
for earnings reports seem to be high, given how well stocks have done in recent
months. Many pundits have been talking about a possible economic boom and sharp
rise in corporate spending. However, with the exception of Intel and selective
financial companies that are using arbitrage-type methods from low interest
rates to boost earnings, there hasn’t been anything very special about the
reports. In fact, even Intel stated that demand in the U.S. was muted, as the
bulk of their earnings gain came from China.
It’s true
that many companies’ bottom-lines are rising, but a large portion of that rise
stems from cost-cutting. The problem with this is that if these companies are
going to start hiring again, as most economists are expecting to maintain the
economic recovery, it would likely crimp their profits. In other words, adding
more workers would most likely lower overall productivity, which would not be
good for the earnings outlook going forward. Another factor that many
economists fail to realize is that a significant amount of jobs were sent
overseas to countries with much lower wages. This, in turn, has also allowed
many companies to achieve better bottom-line results. This trend of white
collar jobs being moved overseas is in its early stages and is showing no signs
of reversing itself. Anyone who is expecting a classic economic recovery and
hiring cycle could be in for a big surprise. Speculation is back on Wall Street
and the fear of missing the upside appears to have once again overcome the fear
of losing money. Since there really is not any sign of the Fed or current
administration changing their policies, especially ahead of the election in
2004, there is no telling how long this period could last. Likewise, there is
also no telling how high stocks could go as a result. Historically, these sort
of liquidity-driven rallies usually end in exhaustion, so it will be important
to keep a close eye on market internals moving forward for signs of weakness.
Daily Pivots for 10-20-03
| Symbol | Pivot | R1 | R2 | R3 | S1 | S2 | S3 |
| COMP | 1924.10 | 1937.95 | 1963.55 | 1977.40 | 1898.50 | 1884.65 | 1859.05 |
| INDU | 9746.43 | 9791.15 | 9860.50 | 9905.22 | 9677.08 | 9632.36 | 9563.01 |
| NDX | 1404.16 | 1416.24 | 1438.46 | 1450.54 | 1381.94 | 1369.86 | 1347.64 |
| SPX | 1042.60 | 1048.62 | 1057.93 | 1063.95 | 1033.29 | 1027.27 | 1017.96 |
| ESZ | 1041.50 | 1048.25 | 1058.75 | 1065.50 | 1031.00 | 1024.25 | 1013.75 |
| SPZ | 1041.13 | 1047.47 | 1057.13 | 1063.47 | 1031.47 | 1025.13 | 1015.47 |
| NDZ | 1405.17 | 1417.33 | 1441.17 | 1453.33 | 1381.33 | 1369.17 | 1345.33 |
| NQZ | 1405.00 | 1417.00 | 1440.50 | 1452.50 | 1381.50 | 1369.50 | 1346.00 |
| BKX | 933.83 | 939.14 | 945.86 | 951.17 | 927.11 | 921.80 | 915.08 |
| SOX | 470.07 | 475.63 | 486.06 | 491.62 | 459.64 | 454.08 | 443.65 |
| DIA | 97.63 | 98.12 | 98.86 | 99.35 | 96.89 | 96.40 | 95.66 |
| QQQ | 34.90 | 35.20 | 35.78 | 36.08 | 34.32 | 34.02 | 33.44 |
| SPY | 104.62 | 105.27 | 106.27 | 106.92 | 103.62 | 102.97 | 101.97 |
| SMH | 38.90 | 39.38 | 40.22 | 40.70 | 38.06 | 37.58 | 36.74 |
Fair Value & Program Levels
Fair Value — (1.36)
Buy Premium — (0.53)
Sell Discount — (2.22)
Closing Premium – (1.52)
Please feel free to email me with any questions
you might have, and have a great trading day on Monday!
