Why You Should Stay On Top Of Your Volatility Bands Today
What Monday’s Action
Tells You
The major indices were just choppy and down until
there was some moderate program action starting in the 2:30 PM time period which
lifted the SPX from 1037.90, or -1.4 points, to a 1044.68 close, plus 5.4 points
or +0.5% on the day. The Dow closed at 9778, +0.6%, Nasdaq 1925, +0.7%,
QQQ 35.06, +1.3%, and SMH 39.20, +1.7%.
NYSE volume was just 1.16 billion shares, volume
ratio 58, and breadth only +286, all of which points to program action in the
SPX and the Generals essentially neutral for the session. This program action is
further identified by the fact that, other than the SMH, no other major sector
outperformed the SPX.
The SPX close of 1044.68 was just above the
midpoint of the pervious day, which was 1044.25. Yesterday’s SPX range was only
8.5 points, but price did close in the top of the range. The volume in the index
proxies was all below average, as it was for INTC, MSFT and the GE’s of the
world.
For Active Traders
It was clear by the market action that the
Generals signed a non-aggression pact yesterday, but that didn’t stop the
well-versed daytrader from getting involved with a confluence of two of my
primary reversal strategies.
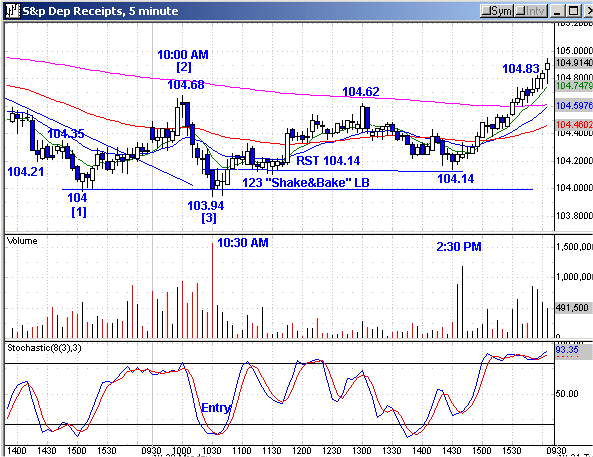
I have included a 5-minute chart in today’s
commentary of the SPY which outlines the two strategies, which are the 1,2,3
lower bottom — or Shake and Bake as you seminar/module veterans recognize —
and also an RST long entry above 104.14, which those of you that have the
seminar material can identify. I have labeled the five primary swing points of
the RST which depict the symmetry. The entry for the 1,2,3 lower bottom was the
reversal of Friday’s 104 low.
As the market continues to chop around, we have
had quite a few reversals of the previous days’ highs and lows, which in itself
is often reason to take a trade, but when you get the 1,2,3/RST, or both, it
makes it a much higher probability trade selection, and that is what gives you
the edge. Notice also that I have labeled the times of the key reversals and
I suggest to you that they are key time periods day in and day out. Go back over
your 5-minute charts and do some mini backtesting and you will see a time
pattern for many of the intraday reversals in the major indices. The first move
on the initial entries was to 104.62, right at the 240-EMA, which was the 1:00
PM bar.
The .618 retracement to 103.94 was 104.20, and
the SPY held at the 104.14 RST entry level which, although not labeled on the
chart, was a bigger 1,2,3 higher bottom setup, with entry above 104.26. You can
see the volume spike at that 2:30 PM reversal period. There was nothing
emotional about the trades as they were both defined patterns that you have
learned from my strategy materials, and I will tell you that hardly a day will
pass where you don’t catch a defined trade from those strategies. That’s fact,
not opinion.
For Today
For today, we start out with the futures green as
I do this at 7 AM. Texas Instruments
(
TXN |
Quote |
Chart |
News |
PowerRating) is trading up above 27 in Europe
on a positive earnings announcement. There are eight trading days left in the
month of October, which is a scorecard month for many of the large mutual funds
and if they can hold the gains or expand them they will. My comments on that
expectation are in the October 13 commentary
The media is certainly trying to help, as they
over-hype some of the numbers, but of course there is no depth to their coverage
as to the quality of earnings. Their coverage on the negative side is blind,
kind of like the New York Times and LA Times on current events that doesn’t
agree with their agendas.
The Dow closed at 9778, above the 8-day EMA of
9735, which is also above all of its 20, 50, 89 and 200-day EMAs, so there’s no
mistaking trend. Yesterday was the third pullback day from the 9850 high. The 2%
zone between 9800 to 10000 is an obvious band of resistance at the down
trendline zone from the bull market highs with the .618 retracement to the
11,750 bull market high at 10,010. The Dow closed right at yesterday’s high of
9778, so you know where the game starts today.
For the past eight days, the SPX has been
churning at the 1.272 Fib extension of the last leg down from 1040.29 on 9/19 to
990.36 on 9/30. That extension level is 1053.87 vs. the current rally high of
1053.79 four days ago. The SPX also closed at yesterday’s high of the range. The
.382 retracement to the 1553 all-time high is 1068.
If the early green futures hold through 9:30 AM,
then it will be second entry long entries only for the SPX and Dow or perhaps
gap pullback setups. If the TXN hype carries the other semis up too much as they
get gapped on the open, then Trap Doors will come into play during the first
hour and it will be smart to be on top of your volatility bands today.
Have a good trading day,
Kevin Haggerty
 ty
ty
