These Lingering Issues Could Present Challenges
The December S&P 500
futures (SPZ and ESZ) turned in a solid performance last week, as
market players bought equities and futures in anticipation of solid economic
reports later in the week.
And they turned out to be right, as Q3 GDP came in at 7.2%, which
was the strongest quarterly gain since 1984. However, the equities and futures
markets saw a “sell the news” scenario after it was released. Some pundits
suggested that the GDP was backward looking, while others suggested that the
news was already factored into stock prices. Either way, little traction was
able to be made to the upside following the data. Another catalyst was a flurry
of mergers with the largest being Bank of America – Fleet First Boston, which
will create the 2nd-largest bank in the country. Mergers can prove to be a
double-edged sword, however, as despite what the companies promise, layoffs
usually follow. The overall gains for the week were done on heavy volume, with
leadership provided by Chip, Financial and Industrial shares.
The December S&P 500 futures closed Friday’s
session with a gain of +1.00 point out of the narrowest range in 2 months, and
closed out the week with a gain of +19.50 points. Volume in the ES was
estimated at 452,000 contracts, which was behind Thursday’s pace and well below
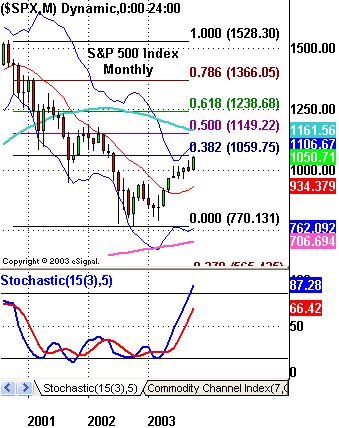
the daily average. On a longer-term basis, the 1,054-60 area continues to be a
strong area of resistance defined by the Oct. high, weekly Fib resistance, and
the 38% Fib retracement of the 3/00-10/02 decline (see chart). On a daily
basis, the contract posted a doji just off the Oct. high, with a confluence of
support still at its 10-day and 20-day MAs. The daily 3-Line break was able to
reverse to the long side, with a new break price of 1,028.50.

As far as
the GDP data went, when looking at the headline number, the report appeared to
be extremely positive. However, when going through the data and looking at how
low activity was in the previous quarter, the strength may have been a bit
overstated. And frankly, given how lackluster economic growth was for over 2
years and the enormous stimulus that was brought forward in Q3, it really should
not come as too big of a surprise that a strong quarter could take place.
Demand in Asia has soared recently, largely due to all the orders that were
postponed earlier in the year because of SARS. Furthermore, activity in the
U.S. also was hurt earlier in the year because of the war of Iraq. When you add
these factors to all stimulus, you get a strong reading. It’s interesting to
note, Japan experienced a quarter even stronger than what recently took place in
the U.S. in the mid-1990’s, which was right in the middle of their deflationary
trend. This is not to suggest that the U.S. is about to follow in Japan’s
footsteps, but to point out that 1 strong GDP number does not mean all will be
well again. The bottom line is this: while the economy appears healthy in the
short term, there still are lingering issues which could present serious
challenges down the road.
Looking ahead this week, we
have an active economic reports calendar with the ISM Index on Tuesday, ISM
Services and Factory Orders on Wednesday, and capped off with the October
Unemployment report on Friday. After last week’s disclosure of strong economic
growth, market players will be seeking signs that the labor market is starting
to recover. The Challenger job-cut report on Tuesday could give a hint, as it
tallies corporate layoffs.
Daily Pivots for 11-3-03
| Symbol | Pivot | R1 | R2 | R3 | S1 | S2 | S3 |
| COMP | 1934.52 | 1940.37 | 1948.53 | 1954.38 | 1926.36 | 1920.51 | 1912.35 |
| INDU | 9809.24 | 9831.74 | 9862.35 | 9884.85 | 9778.63 | 9756.13 | 9725.52 |
| NDX | 1417.80 | 1423.84 | 1431.29 | 1437.33 | 1410.35 | 1404.31 | 1396.86 |
| SPX | 1050.53 | 1053.25 | 1055.80 | 1058.52 | 1047.98 | 1045.26 | 1042.71 |
| ESZ | 1049.42 | 1052.33 | 1055.17 | 1058.08 | 1046.58 | 1043.67 | 1040.83 |
| SPZ | 1049.40 | 1052.10 | 1054.70 | 1057.40 | 1046.80 | 1044.10 | 1041.50 |
| NDZ | 1419.00 | 1426.00 | 1434.00 | 1441.00 | 1411.00 | 1404.00 | 1396.00 |
| NQZ | 1420.33 | 1428.67 | 1439.33 | 1447.67 | 1409.67 | 1401.33 | 1390.67 |
| YMZ | 9776.67 | 9792.33 | 9830.67 | 9846.33 | 9738.33 | 9722.67 | 9684.33 |
| BKX | 942.25 | 944.57 | 947.27 | 949.59 | 939.55 | 937.23 | 934.53 |
| SOX | 496.48 | 500.22 | 503.92 | 507.66 | 492.78 | 489.04 | 485.34 |
| DIA | 98.25 | 98.41 | 98.71 | 98.87 | 97.95 | 97.79 | 97.49 |
| QQQ | 35.25 | 35.45 | 35.68 | 35.88 | 35.02 | 34.82 | 34.59 |
| SPY | 105.44 | 105.65 | 105.96 | 106.17 | 105.13 | 104.92 | 104.61 |
| SMH | 41.66 | 41.97 | 42.31 | 42.62 | 41.32 | 41.01 | 40.67 |
Fair Value & Program Levels
Fair Value — (1.10)
Buy Premium — (0.60)
Sell Discount — (2.52)
Closing Premium – (1.21)
Please feel free to email me with any questions
you might have, and have a great trading day on Monday!
