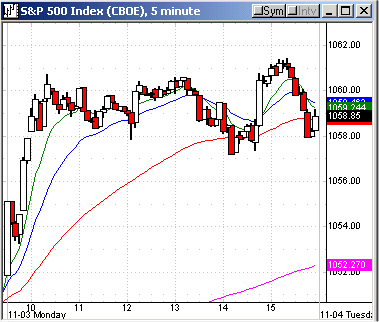
S&P Awareness Zone With These 6 Numbers
What Monday’s Action Tells You
Early up, new money and positive semi news on
chip sales all resulted in a persistent price day on moderate NYSE volume of
1.36 billion, as sellers stepped away from the strong early move and were able
to scale their orders. The SPX
(
$SPX. |
Quote |
Chart |
News |
PowerRating) closed at 1059.02, +0.8%, which
of course, is another new closing high and also a new absolute rally high.
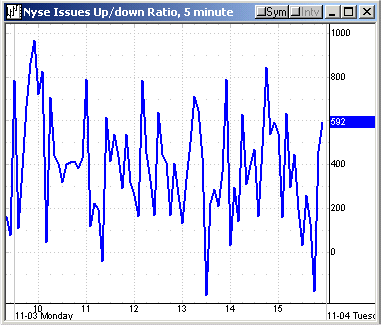
Breadth was positive at +1286. You see on the table that technology had a good
day, with the Nasdaq
(
$COMPQ |
Quote |
Chart |
News |
PowerRating) +1.8% and the
(
QQQ |
Quote |
Chart |
News |
PowerRating)s +1.7%. The volume
ratio was in concert with the breadth at 76, and the four-day moving average at
62 remains short-term overbought.
The major sectors were led by the semis, with the
(
SMH |
Quote |
Chart |
News |
PowerRating) +3.8%, led by
(
NVLS |
Quote |
Chart |
News |
PowerRating) +6.5%,
(
INTC |
Quote |
Chart |
News |
PowerRating) +3.2% and
(
KLAC |
Quote |
Chart |
News |
PowerRating)
+3.4%. (What growth forecast miss?) The XBD was +1.5%, led by
(
GS |
Quote |
Chart |
News |
PowerRating) and
(
MWD |
Quote |
Chart |
News |
PowerRating), both up about 2.4%. The RTH was +1.2%, with the CYC and BKX both
+1.0%. The recovery theme is in full stride coming off the much discussed +7.2%
Q3 GDP number. The fear sectors declined, led by gold, -2.1%, and the OIH -2.0%.
Tuesday 10/28 |
Wednesday 10/29 |
Thursday 10/30 |
Friday 10/31 |
Monday 11/3 |
|
Index |
|||||
SPX |
|||||
| High | 1046.79 |
1049.83 |
1052.82 | 1053.09 | 1061.44 |
| Low | 1031.13 |
1043.35 |
1043.82 | 1046.94 | 1051.84 |
Close |
1046.79 |
1048.11 |
1046.94 | 1050.71 | 1059.02 |
| % | +1.5 | +0.1 | -0.1 | +0.4 | +0.8 |
Range |
15.7 | 6.5 | 9 | 6.1 | 9.6 |
| % Range |
100 | 73 | 35 | 62 | 78 |
INDU |
9748 | 9775 | 9787 | 9801 | 9858 |
| % | +1.5 | +0.3 | +0.1 | +0.2 | +0.6 |
NASDAQ |
1932 | 1937 | 1933 | 1932 | 1968 |
| % | +2.6 | +0.2 | -0.2 | -.02 | +1.8 |
QQQ |
35.38 | 35.32 | 35.39 | 35.15 | 35.77 |
| % | +3.4 | -0.1 | +0.1 | -0.7 | +1.7 |
NYSE |
|||||
| T. VOL |
1.62 | 1.52 | 1.62 | 1.40 | 1.36 |
| U. VOL |
1.23 | 988 | 799 | 763 | 1.02 |
| D. VOL |
390 | 513 | 803 | 654 | 318 |
| VR | 76 | 66 | 50 | 54 | 76 |
| 4 MA | 56 | 60 | 64 | 62 | 62 |
| 5 RSI |
67 | 67 | 64 | 69 | 78 |
| ADV | 2229 | 2065 | 1647 | 1792 | 2270 |
| DEC | 1034 | 1179 | 1634 | 1418 | 984 |
| A-D | +1195 | +886 | +13 | +374 | +1286 |
| 4 MA | +422 | +678 | +803 | +617 | +614 |
SECTORS |
|||||
| SMH | +5.5 | +0.9 | +0.9 | -0.5 | +3.8 |
| BKX | +1.0 | +0.5 | +0.3 | +0.2 | +1.0 |
| XBD | +2.6 | +0.5 | -0.2 | +0.5 | +1.5 |
| RTH | +2.3 | +0.2 | -0.4 | +0.1 | +1.2 |
| CYC | +2.0 | +1.0 | +1.2 | 0 | +1.0 |
| PPH | +1.0 | -0.7 | -1.0 | +1 | -0.1 |
| OIH | +0.6 | -1.4 | +0.5 | +2.4 | -2.0 |
| BBH | +2.0 | -1.3 | -0.2 | +0.9 | -1.0 |
| TLT | +0.5 | -0.9 | -0.4 | +0.9 | -0.5 |
| XAU | -0.7 | +1.8 | -1.8 | +0.5 | -2.1 |
For Active Traders
The
(
SPY |
Quote |
Chart |
News |
PowerRating) gapped open, then made a three-bar
retracement, but it was not enough for a gap pullback setup. The ensuing move
ran to 106.53 by 10:20 a.m. ET, then went sideways at the high zone, so there
was not much opportunity for daytraders. There was a late move from 2:45 p.m. –
3:20 p.m. which had the SPY hitting 106.61, the intraday high, but it was a
quick knife down into the close of 106 during the 4:00 p.m. – 4:15 p.m. time
period. This late fade put the SPY below the midpoint on the close and the
(
DIA |
Quote |
Chart |
News |
PowerRating) at the bottom of its range. I always make note when the index proxies
diverge on a closing basis with the 4:00 p.m. close of the cash index. It makes
you pay attention the next morning. Always be aware of the volume on these
divergent closing moves.
The SPX is right in the zone of confluence
outlined in a chart from previous commentary. 1050 – 1075 has a few numbers that
I will pay attention to regarding how price reacts. We have had six days where
price churned in the 1050 – 1053 level, the beginning of the zone. Yesterday’s
surge to a 1061.44 intraday high and 1059.02 close puts SPX price in the middle
of some confluence. The zone consists of:
- 1056 — The Fib extension down of the leg from
954 – 789. - 1061 — The .707 retracement to the 1176 swing
point high from 769. - 1060 — The .382 retracement to 1530, which is
the retracement high to the 1553 all-time high. - 1068 — The 1.618 Fib extension of the leg
from the 769 October low to 954. - 1068 (again) — This is the primary part of
the confluence, which is also the .382 retracement to the 1553 all-time high
from the market low of 769. - 1074 — The Feb. 22 ’02 resistance level.
There are six numbers less than 2.0% apart, so
obviously you are much more aware of how price reacts in this small zone. Today
is the seventh rally day off the last retracement low of 1018.32 on Oct. 24, and
then this Wednesday through next Tuesday is a time zone, so any long side edge
is greatly reduced. For daytraders, it puts you on alert to not miss any good
intraday short setups because there could be a quick air pocket down from these
new levels.
For Today
The pre-market futures are quiet, so daytraders
are really on hold until the game presents opportunity this morning. I seem to
get frequent e-mails about checking the daily charts for good intraday trading
setups, so I will enclose some charts about what I mean starting tomorrow.
Have a good trading day,
Kevin Haggerty


