Here’s Why The SMH Gives You Setups Most Every Day
What Tuesday’s Action Tells
You
The program gain from 2:00 p.m. to 4:00 p.m.
ET
on Monday was negated yesterday, as the SPX
(
$SPX.X |
Quote |
Chart |
News |
PowerRating) closed back
within
the Slim Jim at 1144.05, -1.0% on the day. (See Monday’s commentary.) NYSE
volume expanded on the downside to 1.62 billion. The price action entering
this
1150 – 1160 price zone has been negative so far, with the 4 MA of advances
minus
declines at just +55, and the 4 MA of the volume ratio at 50. That shouldn’t
be
a surprise after the price-persistent rally in the major indices for the
past
eight to nine weeks with no pullback. The Dow
(
$INDU |
Quote |
Chart |
News |
PowerRating) at 10,609
was -0.9%,
with the Nasdaq
(
$COMPQ |
Quote |
Chart |
News |
PowerRating) -1.8%.
(
NVLS |
Quote |
Chart |
News |
PowerRating) took down much of the tech
sector,
gapping down on the open and closing at 34.39, -14.6%, on a light earnings
report. Five of the major semis were -4.2% to -5.6%, with the
(
SMH |
Quote |
Chart |
News |
PowerRating)s -3.4%
and now 10 days down from its 45.78 high. This, of course, accelerated the
(
QQQ |
Quote |
Chart |
News |
PowerRating)s downside as they finished -2.2%.
(
CAT |
Quote |
Chart |
News |
PowerRating) and
(
DD |
Quote |
Chart |
News |
PowerRating), two
basics
that announced yesterday, opened up, then quickly reversed to the
downside.
All of the major sectors were red yesterday. Once
again, as bonds rose, stocks fell, with the dollar down and gold kicking up,
with the XAU +1.9%.
| size=2> |
Wednesday
1/21 |
Thursday
1/22 |
Friday
1/23 |
Monday
1/26 |
Tuesday
1/27 |
| color=#0000ff>Index | |||||
| color=#0000ff>SPX | |||||
| color=#0000ff>High |
1149.21
|
1150.51
|
1150.31
|
1155.38
|
1155.37
|
| color=#0000ff>Low |
1134.62
|
1143.01
|
1136.85
|
1141.01
|
1144.05
|
| color=#0000ff>Close |
1147.62
|
1143.94
|
1141.55
|
1155.37
|
1144.05
|
| color=#0000ff>% |
+0.8
|
-0.3
|
-0.2
|
+1.2
|
-1.0
|
| color=#0000ff>Range |
14.6
|
7.5
|
13.5
|
14.4
|
11.3
|
| color=#0000ff>% Range |
89
|
12
|
35
|
100
|
0
|
| color=#0000ff>INDU |
10624
|
10623
|
10568
|
10703
|
10609
|
| color=#0000ff>% |
+0.9
|
-0.4
|
-0.5
|
+1.3
|
-0.9
|
| color=#0000ff>Nasdaq |
2142
|
2119
|
2124
|
2154
|
2116
|
| color=#0000ff>% |
-0.3
|
-1.1
|
+0.2
|
+1.4
|
-1.8
|
| color=#0000ff>QQQ |
38.39
|
38.11
|
38.04
|
38.61
|
37.75
|
| color=#0000ff>% |
-0.4
|
-0.7
|
-0.3
|
+1.6
|
-2.2
|
| color=#0000ff>NYSE |
|
|
|
|
|
| color=#0000ff>T. VOL |
1.76
|
1.69
|
1.51
|
1.40
|
1.62
|
| color=#0000ff>U. VOL |
1.03
|
691
|
690
|
974
|
630
|
| color=#0000ff>D. VOL |
721
|
990
|
763
|
404
|
983
|
| color=#0000ff>VR |
59
|
41
|
47
|
71
|
39
|
| color=#0000ff>4 MA |
62
|
60
|
53
|
55
|
50
|
| color=#0000ff>5 RSI |
82
|
70
|
63
|
79
|
55
|
| color=#0000ff>ADV |
2071
|
1717
|
1706
|
1872
|
1421
|
| color=#0000ff>DEC |
1218
|
1580
|
+1600
|
1440
|
1878
|
| color=#0000ff>A-D |
+853
|
+137
|
+106
|
+432
|
-457
|
| color=#0000ff>4 MA |
+534
|
+574
|
+475
|
+382
|
+55
|
| color=#0000ff>SECTORS |
|
|
|
|
|
| color=#0000ff>SMH |
-2.5
|
-1.6
|
-1.3
|
+2.2
|
-3.4
|
| color=#0000ff>BKX |
+1.5
|
-.07
|
-0.4
|
+1.4
|
-0.8
|
| color=#0000ff>XBD |
+1.6
|
-1.9
|
+.04
|
+1.3
|
-1.5
|
| color=#0000ff>RTH |
+1.2
|
+.09
|
+0.8
|
+0.3
|
-0.7
|
| color=#0000ff>CYC |
+2.0
|
-0.3
|
-1.0
|
+1.0
|
-0.9
|
| color=#0000ff>PPH |
+1.7
|
-0.1
|
-0.6
|
+1.5
|
-0.7
|
| color=#0000ff>OIH |
+0.3
|
-1.4
|
-0.3
|
+1.2
|
-0.2
|
| color=#0000ff>BBH |
+1.5
|
-0.5
|
+1.4
|
+1.5
|
-1.6
|
| color=#0000ff>TLT |
+0.2
|
+0.7
|
-1.2
|
-0.7
|
+0.6
|
| color=#0000ff>XAU |
+0.3
|
-1.9
|
-1.5
|
-0.7
|
+1.9
|
There’s lots of media hype around the earnings
season, economic reports, and today they get a chance to hype the Federal Reserve
meeting, so more volatility and opportunity on the reactions for the daytrader.
^next^
For Active
Traders
Traders that were ready for any intraday
short
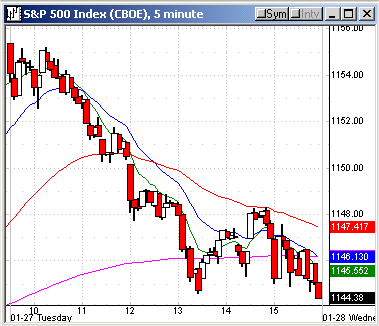
setups in the futures/SPY yesterday got the chance on the breakout of that
17-bar trading range between 1155.06 – 1152.89 from 9:30 a.m. to 10:55 a.m.
It
was trend down from there into the 1144.05 close. Many of the hedge funds
are
sitting on some of the funny money stocks, and it won’t take much to create
an
air pocket as they crowd the exits to ring the register.
Short-term traders have to deal with all of
this
daily noise, but for the longer-term traders’ and investors’ perspective,
the
(
SPY |
Quote |
Chart |
News |
PowerRating)s and
(
DIA |
Quote |
Chart |
News |
PowerRating)s remain above all of their rising 20-, 50-, 89- and
200-day EMAs. The DIAs closed at 106.25 with the 20-day EMA at 105.22, while
the
SPY closed at 114.70, above the 20-day EMA at 113.16. The QQQ is five days
down
from the 39 high, closing yesterday 37.75 vs. the 20-day EMA of 37.63 and
50-day
EMA down at 36.56. Looking at all stocks, both Nasdaq and NYSE, the
percentage
above their 20-day EMA remains above 70%, but has dropped over 5.0% from the
last week.
The primary price and volume thread yesterday
was
clearly the semi decline, with most of the volume well above average, not
including NVLS which traded at six times its volume, and
(
ALTR |
Quote |
Chart |
News |
PowerRating) which
was
-6.8% on three times its normal volume. The lone semiconductor drummer was
(
MU |
Quote |
Chart |
News |
PowerRating) at +4.7% on 100% more than its average volume.
Today’s
Action
The early futures are green at 7:30 a.m., and
today is a Fed meeting, which many times leaves the major indices flat
through
that 2:15 p.m. timeframe, so I don’t know if we will get any downside follow
through in the semis that would set up some Trap Doors. Right now the
(
SMH |
Quote |
Chart |
News |
PowerRating)
and
(
SWH |
Quote |
Chart |
News |
PowerRating) are at the low end of RSI, and the
(
IWM |
Quote |
Chart |
News |
PowerRating) — Russell
2000 — is
at the top of the major indices.
Tech should continue to lead the market bias both
ways, so they continue to be a primary focus on a daily basis, i.e., the SMH
closed at 42.35, right on the 50-day EMA of 42.33 and then the 89-day EMA down
at 40.71. The previous retracement was right to the 89-day EMA in that 38.50
– 39 zone that we had anticipated before the rally to 45.78. Right now, until
proven otherwise, the SMHs remain in a higher-high and higher-low move, and
that means the best short-term positions are on retracements. Because of the
2.8 beta the SMH has, daytraders will continue getting setups most every day.
Have a good trading day,
Kevin Haggerty


