Significant Volume At Inflection Points Means Opportunity
What Thursday’s Action Tells
You
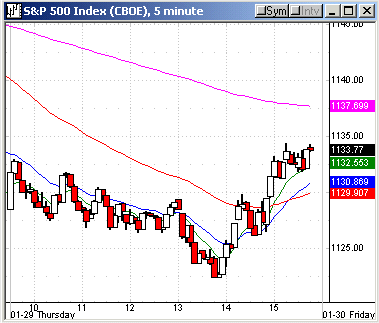
The market action was ugly yesterday, with both
the SPX
(
$SPX.X |
Quote |
Chart |
News |
PowerRating) and Dow
(
$INDU |
Quote |
Chart |
News |
PowerRating) ending +0.4% on a rally from 2:00
p.m. to 4:00 p.m. ET. The Nasdaq
(
$COMPQ |
Quote |
Chart |
News |
PowerRating) ended at -0.6%, while the
(
QQQ |
Quote |
Chart |
News |
PowerRating)s
were essentially flat at the 4:00 p.m. closing time at 37.18, but did tick up
to 37.24 after the bell.
We have seen the divergences in the indices this
year due to the rotation process, as technology has led in both directions,
but I always say “ugly” when the major indices finish green, but have
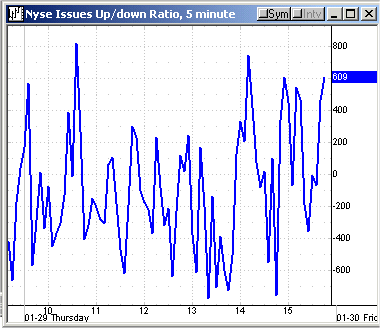
a negative day in breadth and volume ratio that stands out. Yesterday the breadth
was -889, with the 4 MA now -595, and the volume ratio was 42, with the 4 MA
at 43. The 5 RSI is 45, and its low yesterday on the
(
SPY |
Quote |
Chart |
News |
PowerRating), for example,
was 22.44, when the SPY made its low at 112.56. The SPY then reversed the previous
day’s low of 112.94 and the 20-day EMA at 113.20 to close at 113.48. The
(
DIA |
Quote |
Chart |
News |
PowerRating)
5 RSI at the low yesterday was below 10, as the rally went from 104.35 to 105.36,
closing at 105.08. That DIA rally was an excellent setup from an extended two-day
condition and also the .70 retracement to 11,750 from 7197, which is 104.16.
| size=2> |
Friday
1/23 |
Monday
1/26 |
Tuesday
1/27 |
Wednesday
1/28 |
Thursday
1/29 |
| color=#0000ff>Index | |||||
| color=#0000ff>SPX | |||||
| color=#0000ff>High |
1150.31
|
1155.38
|
1155.37
|
1149.14
|
1134.39
|
| color=#0000ff>Low |
1136.85
|
1141.01
|
1144.05
|
1126.50
|
1122.38
|
| color=#0000ff>Close |
1141.55
|
1155.37
|
1144.05
|
1128.48
|
1133.18
|
| color=#0000ff>% |
-0.2
|
+1.2
|
-1.0
|
-1.4
|
+0.4
|
| color=#0000ff>Range |
13.5
|
14.4
|
11.3
|
22.6
|
12
|
| color=#0000ff>% Range |
35
|
100
|
0
|
9
|
95
|
| color=#0000ff>INDU |
10568
|
10703
|
10609
|
10468
|
10507
|
| color=#0000ff>% |
-0.5
|
+1.3
|
-0.9
|
-1.3
|
+0.4
|
| color=#0000ff>Nasdaq |
2124
|
2154
|
2116
|
2077
|
2064
|
| color=#0000ff>% |
+0.2
|
+1.4
|
-1.8
|
-1.8
|
-0.6
|
| color=#0000ff>QQQ |
38.04
|
38.61
|
37.75
|
37.11
|
37.12
|
| color=#0000ff>% |
-0.3
|
+1.6
|
-2.2
|
-1.7
|
+.03
|
| color=#0000ff>NYSE |
|
|
|
|
|
| color=#0000ff>T. VOL |
1.51
|
1.40
|
1.62
|
1.81
|
1.92
|
| color=#0000ff>U. VOL |
690
|
974
|
630
|
383
|
801
|
| color=#0000ff>D. VOL |
763
|
404
|
983
|
1.45
|
1082
|
| color=#0000ff>VR |
47
|
71
|
39
|
21
|
42
|
| color=#0000ff>4 MA |
53
|
55
|
50
|
44
|
43
|
| color=#0000ff>5 RSI |
63
|
79
|
55
|
36
|
45
|
| color=#0000ff>ADV |
1706
|
1872
|
1421
|
943
|
1209
|
| color=#0000ff>DEC |
+1600
|
1440
|
1878
|
2410
|
2098
|
| color=#0000ff>A-D |
+106
|
+432
|
-457
|
-1467
|
-889
|
| color=#0000ff>4 MA |
+475
|
+382
|
+55
|
-347
|
-595
|
| color=#0000ff>SECTORS |
|
|
|
|
|
| color=#0000ff>SMH |
-1.3
|
+2.2
|
-3.4
|
-0.6
|
-0.3
|
| color=#0000ff>BKX |
-0.4
|
+1.4
|
-0.8
|
-1.7
|
+0.3
|
| color=#0000ff>XBD |
+.04
|
+1.3
|
-1.5
|
-3.3
|
+0.7
|
| color=#0000ff>RTH |
+0.8
|
+0.3
|
-0.7
|
-2.5
|
+1.1
|
| color=#0000ff>CYC |
-1.0
|
+1.0
|
-0.9
|
-1.9
|
-1.0
|
| color=#0000ff>PPH |
-0.6
|
+1.5
|
-0.7
|
-1.0
|
+1.1
|
| color=#0000ff>OIH |
-0.3
|
+1.2
|
-0.2
|
-0.5
|
-0.3
|
| color=#0000ff>BBH |
+1.4
|
+1.5
|
-1.6
|
-0.9
|
+1.5
|
| color=#0000ff>TLT |
-1.2
|
-0.7
|
+0.6
|
-1.0
|
-0.2
|
| color=#0000ff>XAU |
-1.5
|
-0.7
|
+1.9
|
-2.7
|
-2.4
|
^next^
NYSE volume expanded yesterday to 1.92 billion,
the most this year, but more significant was the volume in the index proxies.
The DIAs traded 12.6 million shares, the most volume since the March 2003 rally
zone. For the second day, price churned around the 20-day EMA of 105.19, closing
yesterday at 105.08, so you have your early upside pivot should it go green
today.
The SPY traded 60.1 million shares, which is the
most up volume since the retracement to the 89-day EMA on Sept. 30 of 70.8 million
and the following change-in-direction day of 65.8 million. The QQQs are the
most significant with 144 million shares yesterday, which is the most volume
since this entire up-move started from its February lows. A trade was taken
yesterday by this corner, as they traded down to 36.66, right to the beginning
of my zone and right at the 50-day EMA of 36.60 (see yesterday’s commentary).
The daytrade was taken and kept in position
because of the profit cushion at day’s end. They closed at 37.24 (37.18 at
4:00
p.m.). Plus, today is the last day of the month and the eighth day down
since
the QQQs rally high of 39, so maybe there will be some carryover above
yesterday’s doji bar high of 37.31.
The
(
SMH |
Quote |
Chart |
News |
PowerRating)s traded down to 41.05 yesterday vs.
the 89-day EMA at 40.77, then rallied to 42, closing at 41.81, -0.3%. Obviously,
I favor the QQQs and SMHs still because of their deeper retracement levels,
but all of the index proxies are around inflection points after significant
volume increases, and that means opportunity.
Today’s
Action
As always, in the last few days of the month, I
favor setups in the index proxies and HOLDRs, while still scrolling for Slim
Jims in big cap stocks that are obvious mark-up candidates.
Have a good trading day,
Kevin Haggerty


