Rising Price, Declining Volume Into End Of First-Quarter Games
What Tuesday’s Action Tells
You
NYSE volume declined to 1.3 billion as price
advanced again with the SPX
(
$SPX.X |
Quote |
Chart |
News |
PowerRating) +0.4% following a +1.3% day on
Monday with volume also below average at 1.35 billion. Breadth was very
positive
both days at +1538 and +1097 yesterday with corresponding volume ratios of
88
and 72. This market action indicates to me what was expected, barring any
overt
news, that the Generals would make the first quarter positive if they could.
This was also a strong supporting reason in taking the
(
QQQ |
Quote |
Chart |
News |
PowerRating) and
(
SMH |
Quote |
Chart |
News |
PowerRating)
trades from the retracements to their rising 200-day EMAs, in addition to
being
a sequence zone. Those trades are history now, and trailing stops remain in
place on the remaining naked long, always moving stops up, never
lower.
Further indication of this advance in price
and
decline in volume is the QQQ. The initial wide-range-bar change-in-direction
day
on Thursday traded 142.1 million shares, followed by a narrow-range opposite
day
of 78.4 million. The last two days into the 50-day EMA of 35.96 have been
103.9
million and 95.9 million yesterday. The QQQs closed at 35.94,
+0.4%.
In the primary sectors, the positive action
was
led by energy, with the
(
OIH |
Quote |
Chart |
News |
PowerRating) +2.6% and XLE +1.8%. Next was the
cyclicals/basics with the CYC +1.0% and XLB +0.7%. The SMH actually closed
slightly green at +0.1% after being down about -1.4% at 1:00 p.m. ET, while
at
the same time, the SPX was off just a point. Needless to say, daytraders won
the
game in the afternoon.
Wednesday 3/24 |
Thursday 3/25 |
Friday 3/26 |
Monday 3/29 |
Tuesday 3/30 |
|
Index |
|||||
| SPX |
|||||
High |
1098.39 | 1110.38 | 1115.27 | 1124.37 | 1127.60 |
Low |
1087.06 | 1091.33 | 1106.13 | 1108.06 | 1119.66 |
Close |
1091.32 | 1109.28 | 1108.20 | 1122.47 | 1127.00 |
% |
-0.2 | +1.6 | -0.1 | +1.3 | +0.4 |
Range |
11.3 | 19.1 | 9.1 | 16.3 | 7.9 |
% Range |
38 | 94 | 23 | 88 | 93 |
INDU |
10048 | 10219 | 10213 | 10330 | 10382 |
% |
-0.2 | +1.7 | -.06 | +1.1 | +0.5 |
Nasdaq |
1909 | 1967 | 1960 | 1993 | 2001 |
% |
+0.4 | +3.0 | -0.4 | +1.7 | +0.4 |
| QQQ |
34.41 | 35.34 | 35.22 | 35.85 | 35.92 |
% |
+1.1 | +2.7 | -0.3 | +1.8 | +0.4 |
NYSE |
|||||
T. VOL |
1.50 | 1.48 | 1.32 | 1.35 | 1.30 |
U. VOL |
448 | 1.25 | 734 | 1.18 | 925 |
D. VOL |
1.02 | 215 | 571 | 166 | 360 |
VR |
31 | 85 | 56 | 88 | 72 |
4 MA |
29 | 44 | 56 | 65 | 75 |
5 RSI |
24 | 52 | 66 | 65 | 70 |
ADV |
1148 | 2358 | 1789 | 2428 | 2186 |
DEC |
2098 | 911 | 1499 | 890 | 1089 |
A-D |
-950 | +1447 | +290 | +1538 | +1097 |
4 MA |
-760 | -211 | +313 | +581 | +1093 |
SECTORS |
|||||
SMH |
+2.0 | +4.0 | -0.9 | +1.1 | +0.1 |
| BKX |
-0.5 | +1.3 | -0.2 | +1.5 | +0.4 |
XBD |
-1.3 | +2.5 | +1.4 | +1.6 | +0.2 |
RTH |
+0.3 | +2.3 | -0.3 | +1.2 | +0.2 |
CYC |
-0.4 | +2.2 | +0.3 | +1.8 | +1.0 |
PPH |
-0.8 | +0.7 | +0.1 | +1.4 | -0.2 |
OIH |
-3.0 | +0.8 | +1.2 | -0.3 | +2.6 |
| BBH |
+1.1 | +2.0 | -1.5 | +2.1 | -0.3 |
TLT |
-.07 | -0.4 | -1.1 | -0.7 | -0.7 |
| XAU |
-2.4 | +2.6 | +1.0 | +0.9 | +1.1 |
^next^
For Active
Traders
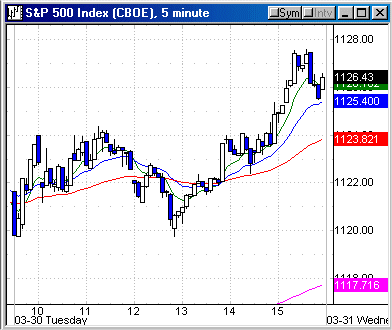
Until 1:00 p.m., the SPX drew a line at the
1124
– 1120 zone until there was a trend up into the close of 1127 from 1119.72
and a
re-cross of the 20 EMA on the 30-minute chart. On your five-minute chart, it
would be the 120 line. The better trade setups were in the SMH and QQQs, and
I
was pleased with the e-mails that took one or both of them. The SMH was an
RST
long entry above 38.91 on the 1:00 p.m. bar, followed by the 1,2,3 higher
bottom
above 39 on the 1:40 p.m. bar which then re-crossed both primary EMAs in the
“523” trend, which in effect, is the same as a re-cross of a
rising 200-day EMA
on a daily chart, except in the longest intraday timeframe, which I consider
the
120-minute. The trade ran +1.5% from the entry level of the RST pattern and
closed 39.55.
The QQQs had the exact same RST and 1,2,3
higher
bottom setups. The RST gave you entry above 35.60, right at the 240 EMA and
advanced +1.0% to 35.94, closing at 35.91. Both trades had other confirming
sequence tools in play at the setup levels.
Today’s
Action
For today, we have the last day of the
quarter,
and the Generals will at least hold levels in their major holdings, which
will
do the same for the SPX. This quarter end mark-up has put the 4 MA of the
volume
ratio at 75, and the 4 MA of breadth is now +1093, with the five-day RSI at
70.
This could hold for a few days if the Generals put some money to work at all
in
early April, but that can be followed by an air pocket down.
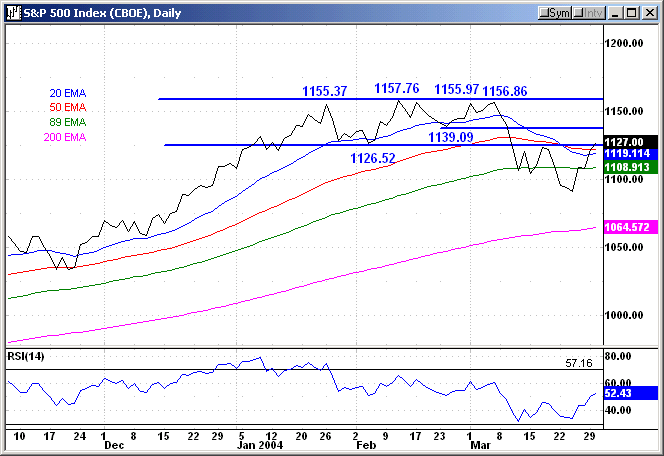
The SPX closed at 1127, right at the minor
resistance line you see on today’s chart, which are drawn through the
significant closes. Line charts give you much more clarity on levels.
1122.16 is
the 50-day EMA, 1125.15 is the .50 retracement to 1163.23, with the .618
retracement at 1134.14, and then followed by a minor resistance line at
1139.09.
This is just a scorecard to be alert for price action at those levels for
any
reversal setups.
For the SPY, which closed at 112.97, the
lines
are 112.90 and 113.85, with the 50-day EMA below at 112.62. The QQQ levels are
the
50-day EMA of 35.96, the resistance line at 36 and the downsloping channel
line
at about 36.50. For the
(
DIA |
Quote |
Chart |
News |
PowerRating)s, which closed at 104, it is the 50-day
EMA at
103.76, the .50 retracement at 103.57, the .618 at 104.38 and the .786 is up
at
106.17. The SMHs have line resistance at 40, followed by the 50- and 89-day
EMAs
at 40.38 and 40.41. There is a retracement line to the 45.78 high at 41.31
and a
channel line at 41.50.
The picture is on your desk, now watch the
price
action and do your thing. Don’t let the stock ghosts control your emotions
when
the sequence is there.
Have a good trading day,
Kevin Haggerty


