Fertile Ground For Traders
What Wednesday’s Action Tells
You
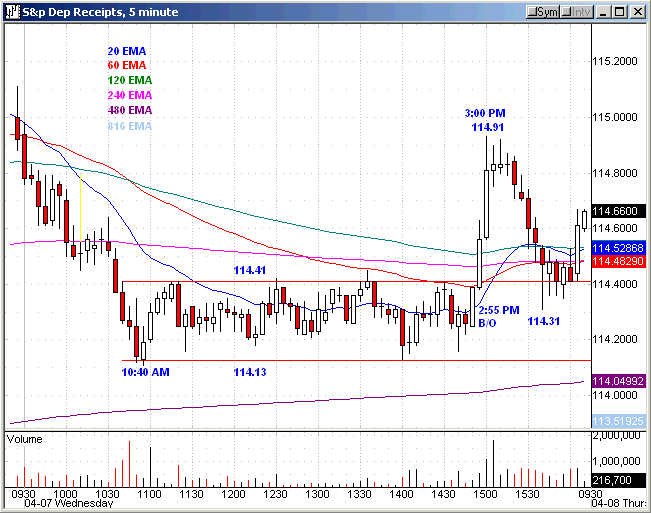
The major indices traded down into the 10:40
a.m.
ET time period, the intraday lows, then formed a Slim Jim until a quick
breakout
on the 2:55 p.m. bar, which reversed on just the second bar for the
(
SPY |
Quote |
Chart |
News |
PowerRating).
The SPX
(
$SPX.X |
Quote |
Chart |
News |
PowerRating) closed at 1140.50, -0.7%, with the Dow
(
$INDU |
Quote |
Chart |
News |
PowerRating)
10,480, -0.9%. Technology did a little better, with the Nasdaq
(
$COMPQ |
Quote |
Chart |
News |
PowerRating)
-0.5% and the
(
QQQ |
Quote |
Chart |
News |
PowerRating)s -0.1%. NYSE volume was average at 1.45 billion,
with a
volume ratio of 34 and breadth -73. In the sectors, the
(
OIH |
Quote |
Chart |
News |
PowerRating), +0.8%,
and
XAU, +0.4%, closed green. The
(
SMH |
Quote |
Chart |
News |
PowerRating) was the best of the red at -0.2%.
The
market action yesterday reflects the eight straight days up for the SPX and
pre-holiday trading. Thursday probably won’t offer much more.
I will be traveling on Thursday, so I am
doing
this Wednesday night and don’t know what the funny money GLOBEX futures
market
has in store for you, but without any overt news, you should not expect
much.Â
| Â | Thurs. 4/1 |
Friday 4/2 |
Monday 4/5 |
Tues. 4/6 |
Wed. 4/7 |
Index |
 |  |  |  |  |
| SPX |
 |  |  |  |  |
High |
1135.67 | 1144.81 | 1150.54 | 1150.57 | 1148.16 |
Low |
1126.20 | 1132.17 | 1141.64 | 1143.30 | 1138.41 |
Close |
1132.17 | 1141.80 | 1150.54 | 1148.17 | 1140.50 |
% |
+0.5 | +0.9 | +0.8 | -0.2 | -0.7 |
Range |
9.5 | 12.6 | 8.9 | 7.3 | 9.8 |
% Range |
63 | 76 | 100 | 67 | 21 |
INDU |
10373 | 10471 | 10558 | 10571 | 10480 |
% |
+0.2 | +0.9 | +0.8 | +0.1 | -0.9 |
Nasdaq |
2015 | 2057 | 2079 | 2060 | 2050 |
% |
+1.0 | +2.1 | +1.1 | -0.9 | -0.5 |
| QQQ |
36.16 | 37.10 | 37.45 | 37.00 | 36.94 |
% |
+0.9 | +2.6 | +0.9 | -1.2 | -0.1 |
NYSE |
 |  |  |  |  |
T. VOL |
1.52 | 1.61 | 1.40 | 1.39 | 1.45 |
U. VOL |
1.04 | 1.10 | 894 | 531 | 485 |
D. VOL |
472 | 493 | 485 | 846 | 942 |
VR |
69 | 69 | 65 | 38 | 34 |
4 MA |
71 | 67 | 65 | 60 | 52 |
5 RSI |
74 | 81 | 85 | 79 | 61 |
ADV |
2174 | 1752 | 1538 | 1200 | 1611 |
DEC |
1121 | 1573 | 1832 | 2122 | 1684 |
A-D |
+1053 | +179 | -294 | -922 | -73 |
4 MA |
+1114 | +774 | +426 | +4 | -130 |
SECTORS |
 |  |  |  |  |
SMH |
+1.6 | +3.2 | +1.2 | -2.2 | -0.2 |
| BKX |
+0.7 | -1.2 | +0.5 | +0.3 | -0.6 |
XBD |
+1.2 | -0.1 | -0.5 | -0.3 | -0.3 |
RTH |
-0.9 | +0.1 | +0.9 | +0.4 | -1.1 |
CYC |
+0.8 | +1.6 | +0.4 | -0.4 | -1.0 |
PPH |
+0.9 | +1.1 | +0.9 | -0.4 | -0.3 |
OIH |
-2.7 | +0.8 | +0.4 | -0.8 | +0.8 |
| BBH |
+1.9 | +2.1 | +0.2 | -1.1 | -1.2 |
TLT |
-0.3 | -2.5 | -0.8 | +0.5 | -0.2 |
| XAU |
+0.4 | -1.0 | -2.4 | +0.6 | +0.4 |
For Active
Traders
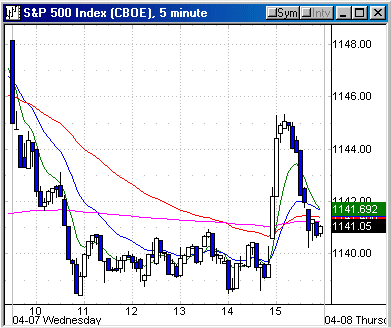
The SPX traded down to the 1.28 volatility
band
with an intraday low of 1138.41 (1.28 volatility band — 1138.53), then
formed a
Slim Jim until a breakout above 1140.92 on the 2:55 p.m. bar, but only
traded to
1145.34 on the 3:10 p.m. bar. The agenda ended almost as fast as it started,
and
the SPX traded back down to an 1140.50 close.
I have included the SPY chart with the Slim
Jim
trade on a breakout above 114.41, which carried to 114.91, but immediately
reversed. If you take profits on part of your position at 2x risk or more,
you
did okay, but the worst case was a scratch trade on balance. The ESM4 entry
was
above 1140, running 5 points to 1145.
If you were involved in individual stocks,
there
were many Slim Jims in the big-cap SPX stocks, which of course, is why you
see
the pattern in the index. There were also some short opportunities in
various
stocks that have retraced back up to their 200-day EMAs and then reversed
the
previous day’s low in yesterday’s trading.
As I have mentioned before, [INTC|INTC[ and
(
MSFT |
Quote |
Chart |
News |
PowerRating) are two core trading stocks, and both of those provided short
entries yesterday. INTC, as it traded below the previous day’s 28.04 low
down to
27.48 following the 200-day EMA retracement from 26 — the 200-day EMA is
28.21
— with the retracement high at 28.56.
Today’s
Action
Keep your powder dry today unless there are
some
defined setups. Slim Jims in the afternoon might be fertile ground as
traders
tuck it in for the weekend.
Have a good trading day,
Kevin Haggerty


