Wednesday’s Levels
Tuesday Recap: We had another
good day Tuesday with a profit of $155.Â
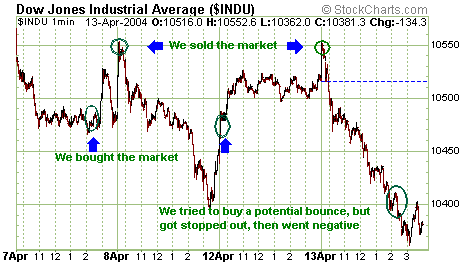
In our prediction for Tuesday, we said the major
indices would move higher, but we wondered if they would break resistance.Â
Further, we predicted that if upside resistance was not broken it would lead to
selling. In fact on Tuesday, we sent an e-mail to members telling them to sell
the market at what turned out to be near the highs of the day: our predicted
resistance point on the cash Dow, 10550. From there the market stair-stepped
lower, breaking moving average and chart support in its path to close the day at
10381, down some 134 points.Â
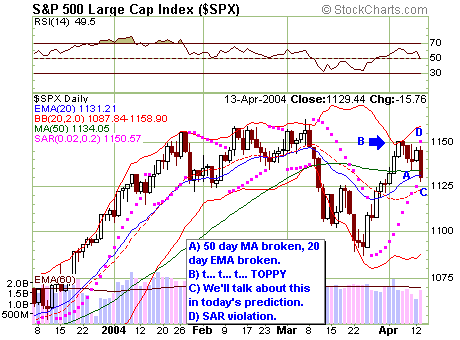
Like the chart for the Dow, the S+P chart is ugly
for market bulls. Strong support was broken at both the 50 day MA and the 20
day EMA. Further, minor support and a clue to a trend change was signaled when
the S+P violated SAR support (pink dot).Â
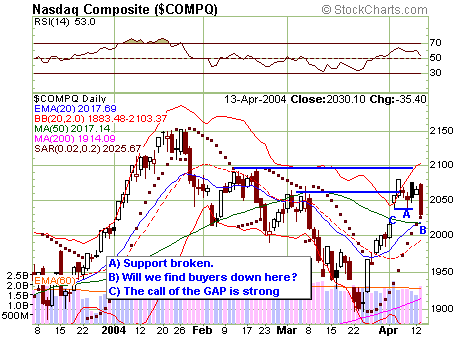
The chart of the NASDAQ isn’t quite as ugly as
that of the Dow and S+P, but nonetheless it doesn’t paint a pretty picture for
market bulls. While the NAS didn’t violate minor SAR support, it nonetheless
broke chart support at level A. We have more to say about these markets in
today’s predictions.Â
Prediction for Wednesday:
Tuesday late in the trading session we moved the portfolio to slightly delta
negative, anticipating a move lower on Wednesday. We might get that move lower,
but we will also start to watch for a bounce at some point.Â
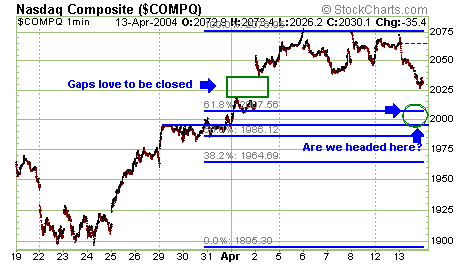
On the cash NAS, at a minimum I expect the gap we
have identified above to fill. I think the indexes might find some support near
the 50 day MA and the 20 day EMA, which are currently converging near the 2017
region. Also providing some support might be the RSI, which is testing the 50
level. A clear break of 50 on the RSI might provide clues to further selling.Â
However, if that doesn’t hold, we’ll watch a Fib retracement number just above
2000 and then chart support near 2000. Ultimately this might be where the NAS
is headed. I think the NAS will lead the market, so if support holds or is
broken the entire market may take its queue from the NAS.    Â
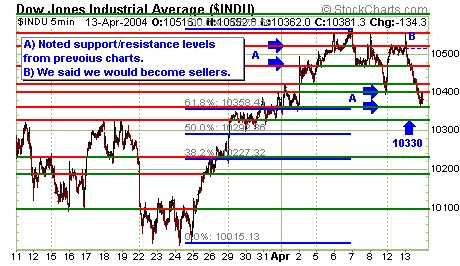
On the cash Dow, we’ll watch for a quick test of
the 10358 level, another Fib retracement level and some chart support. Note
that yesterday this brought buyers to the plate. If this is broken, we might
find some buyers near 10330. Importantly, on the upside I’ll watch 10400. If
this level is broken and holds we could head higher. We’ll also keep an eye on
the RSI at 50. This could provide support and, if broken, clues to market
weakness.Â
On the cash S+P I think we might be headed for
the 1125 level (marked C in the daily chart above). The S+P looked sort of
toppy at 1150, and like the Dow it fired off some sell signals Tuesday that we
observed and got the portfolio negative.Â
Portfolio Strategy: Right now we
are slightly delta negative, but very close to neutral. We’re likely to remain
negative until the cash Dow climbs above 10400. Further, we’re going to start
to peel back some of our close to the money April options that expire this
Friday, particularly the options that are looking to be in the money. We’re
also starting to look at our set-up for May options and might have new trades
towards the end of this week.
Daily Profit: $155
9700 April Mini Dow Put Options: We are long 2
put options. Yesterday they settled at 2, unchanged 2 (each point is worth $5).
Loss yesterday with this position was $0.
9900 May Mini Dow Put Options: We are long 2 put
options. Yesterday this option settled at 74, up 27. Profit yesterday on this
position was $270.
10000 April Mini Dow Put Options: We are short
four put options. Yesterday this option settled at 7, up 3. Loss yesterday
with this position was $60.
10400 April Mini Dow Call Options: We are short
two call options. Yesterday this option settled at 40, down 90. Profit
yesterday with this position was $900.
10400 April Mini Dow Put Options: We are short
two put options. Yesterday this option settled at 87, up 54. Loss on the day
with this position was $540.
10500 April Mini Dow Put Options: On 4/13/04 we
bought one mini Dow put option for 159, closing out this position. We are now
flat this option. Loss yesterday with this position was $495.
Mini Dow Futures: We came into the day long one
mini Dow future. We sold that future at 10536, near the high of the day. We
then purchased a mini Dow future at 10382 and sold it back at 10363. Profit
yesterday with this position was $70. We are now flat the mini Dow future.Â
Projected Net Maintenance Margin Required
(Minimum amount required to
trade this position, may vary broker to broker. Amount specified is
derived from our options analysis software):Â $8,788
Current Projected Delta: -.96
Current Projected Gamma: -91.36
Trading Method:Â Mark Melin strategically short sells options and then
directionally trades within this short options portfolio, always hedging one
position against another to generate consistent profits.
DISCLAIMER:
Past performance is not necessarily indicative of future results.
There is a substantial risk of loss in commodity futures and options trading.
It is not suitable for all investors. Only you can determine whether this
trading suits your particular needs and risk tolerance.
All profit and loss representations are hypothetical and based on the Real
time signals generated by The Dow Trader. The results have not been adjusted to
reflect slippage or commission charges. No representation is being made that
any account will or is likely to achieve profits or losses similar to those
shown.
Â
