Out-Trade The Analysts Every Time–Here’s How
What Tuesday’s Action Tells
You
The programs let up yesterday after the
normal
fourth-quarter surge. All but one of the last five or six October starts
have
been up strong the opening day(s) of the fourth quarter. That’s why I said
“don’t get carried away with price” the other day. The risk
profile of this
current market is very high, and there is a key time zone the third week in
October. The odds favor that as a temporary bottom if the current rally has
some more
gas. This cyclical up-market since October 2002 is approaching a very
high-risk
termination period as it is more than two years in length. Should the major
indices trade down into the second half of October, then the odds tilt
strongly
to a higher push into year-end. The Generals want to lock in the highest
returns
possible this year because 2005 could be slim pickings, that is also true of
many
hedge funds because 20% of nothing is nothing, so they will try to max it
this
year-end.
Yesterday’s market action was choppy as the
SPX
(
$SPX.X |
Quote |
Chart |
News |
PowerRating) had a range of less than 6 points, closing at 1134.48, off
less
than a point, while the Dow
(
$INDU |
Quote |
Chart |
News |
PowerRating) was -0.4% to 10,178, having bounced
off
our first minor support level yesterday at 10,158. This was also the intraday
low made on the 3:10 p.m. ET bar with the 480 EMA (20 EMA on 120-minute
chart)
at 10,155. It traded to 10,185 before closing at 10,178.
The Nasdaq
(
$COMPQ |
Quote |
Chart |
News |
PowerRating) at 1955 and
(
QQQ |
Quote |
Chart |
News |
PowerRating)
at 36.37 were each +0.2%, while the
(
SMH |
Quote |
Chart |
News |
PowerRating) was essentially unchanged. The
XAU
was +2.5% with the
(
BBH |
Quote |
Chart |
News |
PowerRating) -2.5%, while the primary institutional sectors
were
all small red at the close.
NYSE volume dropped again to 1.42 billion as
the
programs subsided with the volume ratio at 41 and breadth -56.
For Active
Traders
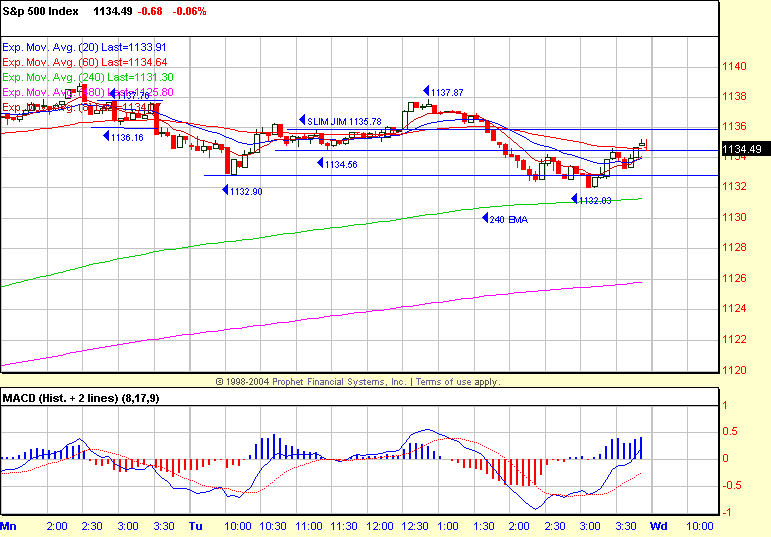
The SPX opened down small to an 1132.90 low
on
the 10:05 a.m. bar, and then reversed on the contra move to 1136.22 and went
Slim Jim
until 12:30 p.m. On the five-minute chart, you see that the breakout only traded
to 1137.87, and then the afternoon trend was down as price resumed the direction
of the open, making a new intraday low to 1132.03 and
closing at
1134.49. It wasn’t an easy day as the Trap Door wasn’t really discounted
enough
in price, and then the Slim Jim aborted after a small up before reversing to
a
pattern failure. How you played it depended on your thoughts after the five
up-days into the 1135 – 1141 resistance zone. Remember, it’s the dynamics that
make
the pattern, not the pattern.
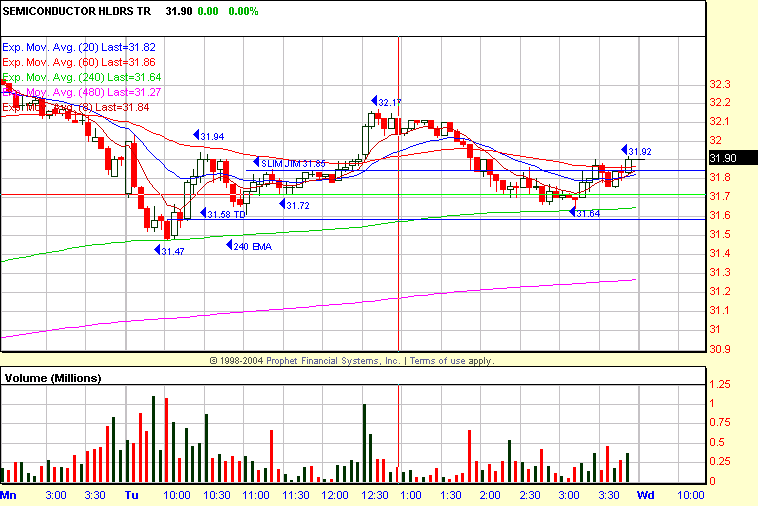
The SMH was the best setup with a
Trap Door
low
at 31.47 and the 240 EMA. This was -1.3% from the previous close and -1.7%
from
the 32.03 second-bar high. Refer to Monday’s “520 Trend” chart,
and you’ll see
that the RST entry was below the 32.06 low. The initial move was +1.1% from
the
31.58 entry level to 31.94. Some of you might have also taken the 1,2,3
Higher
Bottom entry on the retracement or maybe the Slim Jim breakout above 31.85
which
traded +1.0% to 32.17. 32.18 is the previous swing point high on the daily
chart
and also the 2 point off the 1,2,3 Higher Bottom of this rally.
Today’s
Action
The SMH closed at 31.92 with the 32.18 swing
point high above and the 240 EMA at 31.64 and 480 EMA at 31.27 (five-minute
chart). The 50- and 20-day EMAs are 31.14 – 30.69. Refer to that SMH daily
chart
for the higher price zone.
The Dow has the same frame of reference today,
with minor support at 10,158 – 60 and then the 200-day EMA at 10,103. The
upper
level remains at about 10,300 which is the 200-day EMA and also the
downtrend
channel line. The Dow Transports hit a 3343 intraday high yesterday vs. the
1.618 Fib extension of the 3212 – 2960 leg up, which is 3368. A reversal
down
for the Transports could be the early read for a Dow decline, and that has a
much higher probability than the Dow making new highs above 10,750 during
this
current move off its 9978 low.
The SPX has 1131.54 as its initial downside
alert, which was the 1,2,3 Higher Bottom trend entry, then the 1141 .786
retracement level and also the 1140.19 rally high.
Minor support for the QQQ starts today at the
36.10, then 35.80 levels (240 and 480 EMAs). The 200-day SMA is
35.83.
The fourth quarter initial price push has
gotten
the Election Synthetic Straddle off to an excellent start, and next we have
the
media-famous Jobs Report this Friday which could add more volatility. You do
remember the 32,00 jobs report that the media and Democrat herd said was the
beginning of the Depression, but instead was the beginning of the current
+13.2%
QQQ move and +17% SMH run, while all of those overpaid analysts were downgrading
all the way. They will be right in the not-too-distant future, but the good
trader from key price zones will out-trade them all the time.
Have a good trading day,
Kevin Haggerty
Spend the next year trading with me.Â
Click here for details.
Â


