Profiting From TradingMarkets: How To Use The Stock Scanner–Part 3
Editor’s Note:
Each night we feature a different lesson from
TM University. I hope you enjoy and profit from these.
E-mail me if you have
any questions.
Brice
In Part 1 of this series, I scanned for stocks in
strong uptrends as measured by Relative Strength (RS). In Part 2, I
scanned for stocks in strong downtrends (for potential shorts) as measured by
high ADX readings. In Part 3 of this series, we’ll look at one of Kevin
Haggerty’s favorite scans.
As a momentum
trader, I saw StockScanner as a tool only useful for finding stocks in strong
trends. To my surprise, when I asked Kevin Haggerty to show me one of his
favorite scans, he showed me a scan that looks for stocks that are in
consolidations and/or in early phases of trend.
Before we get into
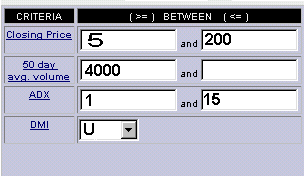
his reasoning behind his scan, let’s look at the scan itself. Kevin scans for a
price of between 5 and 200, a 50-day average volume of at least 400,000 shares
(which equates to 4000 in StockScanner); an ADX of between 1 and 15; and trend,
as measured by DMI, to be up. In addition, he requires the price to be greater
than the 200-day moving average. Figure 1 below shows what this scan would look
like.
and

Breaking It Down
Price
A price of between 5
and 200 gives Kevin a wide range of stocks to choose from. In general, the
lower-priced stocks may lend themselves more to position trades (as they
fluctuate less on a point basis) and those higher-priced stocks, (which tend to
fluctuate more on a point basis), may lend themselves more to
shorter-term or daytrades. He puts a top end of 200 in order to avoid extremely
high price stocks. Kevin states that often these can have very high spreads
(i.e., bid/ask), making them difficult to trade.
Volume
Kevin requires an
average volume of at least 400,000 shares.* As we discussed in previous
articles, active traders, in general, should focus on more liquid issues.
Greater Than 200-Day Moving Average
This is used to
ensure that the stocks are in longer-term uptrends.
ADX and “U” DMI
The ADX of between 1
and 15 with a DMI of U (up, that is, +DMI > -DMI) provides stocks that are the
early phases of uptrends. Remember, the higher the ADX, the higher the trend.
For those unfamiliar with ADX, you might want to read
Capturing Trends With ADX before continuing.
Kevin’s Reasoning
Kevin uses this scan
to help find stocks that have the potential to break out or exhibit some sort of
other bigger-picture technical pattern. Also, it helps him to find stocks that
may be in the early phases of beginning a trend. In addition, many of these
stocks produced by this scan are at an “equalibrium†point from which they can
make a large swing.
Kevin states: “This
is what I often use to find trades that can be intraday, position, or both. It
usually gives me consolidations and pullbacks to key averages when a stock
volatility narrows.”
The Results
The scan was run on
03/17/2000. It produced the following stocks:
| Date | Symbol | Stock
Name |
Sub
Sector |
Price | 50 DAV (00) | ADX | DMI |
| 3/17/00 | AAPL | Apple
Computer Services  |
Computer
Services Hardware |
125 | 39913 | 11 | U |
| 3/17/00 | ADBL | Audible | ComputerServices | 12.25 | 5072 | 12 | U |
| 3/17/00 | AGIL | AgileSoftware | Software&
Programming |
76 | 6532 | 10 | U |
| 3/17/00 | AHP | American
HomeProducts |
MajorDrugs | 51.44 | 45599 | 13 | U |
| 3/17/00 | AOL | AmericaOnline | ComputerServices
Services |
64.25 | 295921 | 14 | U |
| 3/17/00 | AZPN | AspenTechnology | ComputerServices
Networks |
47.38 | 5346 | 14 | U |
| 3/17/00 | CBLT | CobaltGroup | ComputerServices
Services |
13.88 | 4965 | 14 | U |
| 3/17/00 | CBS | CBSCorporation | Broadcasting
&CableTV |
59.69 | 26579 | 12 | U |
| 3/17/00 | CMB | ChaseManhattan
Corp |
MoneyCenterBanks | 91 | 46492 | 15 | U |
| 3/17/00 | CZN | CitizensUtilities | ElectricUtilities | 16.5 | 9103 | 13 | U |
| 3/17/00 | EMC | EMCCorporation | Computer
Services StorageDevices |
129 | 59552 | 13 | U |
| 3/17/00 | GPS | The Gap | Retail(Apparel) | 46.44 | 31110 | 12 | U |
| 3/17/00 | IATV | ACTV | Communications
Equipment |
31.88 | 10027 | 14 | U |
| 3/17/00 | INF | InfinityBroadcasting | Broadcasting
&CableTV |
32.88 | 18386 | 12 | U |
| 3/17/00 | INIT | Interliant | BusinessServices | 44.88 | 7348 | 13 | U |
| 3/17/00 | JWEB | JunoOnlineServices | Computer
Services |
21.38 | 8733 | 9 | U |
| 3/17/00 | LTWO | Learn2.com | Software&
Programming |
5.97 | 14190 | 15 | U |
| 3/17/00 | MANU | ManugisticsGroup | Software&
Programming |
60 | 6867 | 15 | U |
| 3/17/00 | NPNT | NorthPoint
Communications |
Communications
Services |
28.44 | 16494 | 15 | U |
| 3/17/00 | PMTC | Parametric
Technology |
Software&
Programming |
29.69 | 45777 | 15 | U |
| 3/17/00 | PSFT | PeopleSoft | Software&
Programming |
24.31 | 55866 | 15 | U |
| 3/17/00 | QCOM | QUALCOMM | Communications
Equipment |
136.25 | 184121 | 12 | U |
| 3/17/00 | RDA | Reader’sDigest | Printing&Publishing | 35.06 | 4584 | 14 | U |
| 3/17/00 | SSW | SterlingSoftware | Software&
Programming |
35 | 10564 | 15 | U |
| 3/17/00 | SUNW | SunMicrosystems | ComputerServices
Hardware |
96.13 | 166234 | 13 | U |
| 3/17/00 | TOS | Tosco | Oil&GasOperations | 28 | 11110 | 14 | U |
| 3/17/00 | VRTY | Verity | Software&
Programming |
52.88 | 7897 | 15 | U |
| 3/17/00 | YHOO | Yahoo! | ComputerServices
Services |
171.13 | 129525 | 11 | U |
Picking Stocks From The Scan
From the results,
Kevin picked the following stocks based on technical patterns. Let’s look at
these patterns and how he would use them for potential trades.
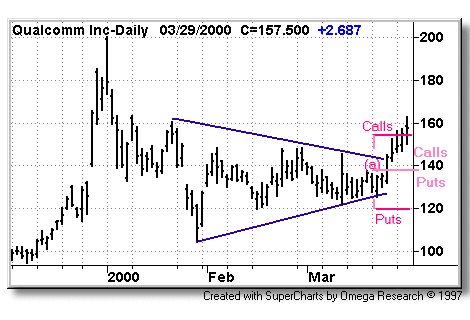
On the date of the
scan, 03/17/200 (a), Qualcomm was forming a big-picture symmetrical triangle.
This narrowing of volatility suggests that a breakout is imminent. Because the
volatility is low, options tend to be fairly priced.
Considering the
above, Kevin saw this as a potential opportunity for an option strategy that
seeks to capitalize on an increase in volatility combined with a breakout. Such
strategies include a straddle (buying at-the-money calls and puts, shown in the
middle of the triangle in the chart above) and, to a lesser extent, a strangle
(buying out-of-the-money calls and puts, shown outside of the triangle in the
chart above). Once positioned, Kevin states that he will often “lift a leg” of
the position (in other words, as in this case, in an upside breakout, he would
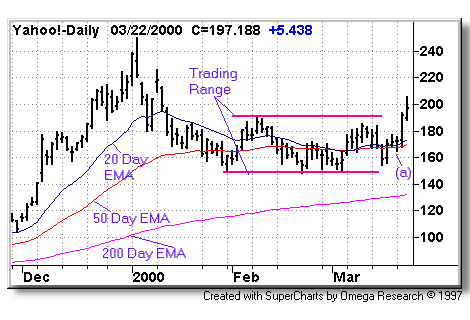
sell the puts and keep his long call position). Looking at Yahoo! on 03/17/2000
(a), “Here we have a trading range with stock above both the 20- and 50-day
exponential moving average (EMA). I look for an entry above the 50-EMA. And
because YHOO is at the equilibrium point of the trading range, it is a good
candidate for an option strategy.”
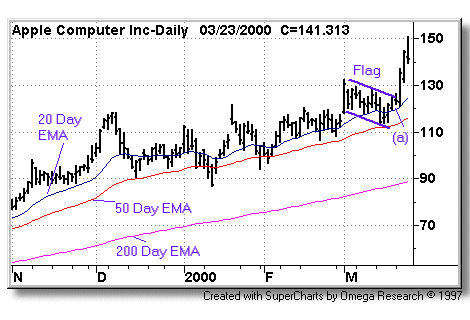
On 3/17/2000 (a),
Apple Computer, a stock in a long-term uptrend based on its 200-day EMA, is
trading above its 20- and 50-day exponential moving averages (EMAs). Notice that
the stock has formed a flag down to its 50-day EMA. This “pullback” type pattern
provides a low risk entry.
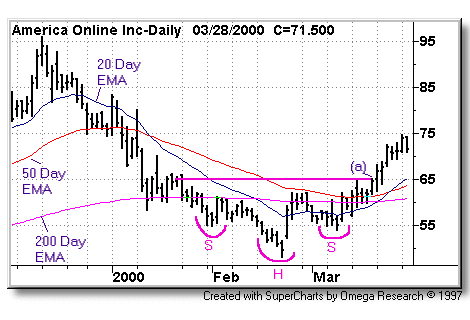
On 03/17/200 (a),
American Online has formed a big-picture head-and-shoulders bottom. Also notice
that the 200-day EMA was flat and the 20- and 50-day EMAs have turned up.
Q&A
DL: This scan isn’t
your typical “momentum scan.” Do you also do momentum scans?
KH: This scan is
used to find stocks that are consolidating in uptrends — often, near the
200-day moving average. Everyone is looking for breakouts on high volume,
pullbacks, strong trend, etc. This gives me a chance to catch these stocks
before it is obvious to everyone. I’ll also do momentum scans. I showed you
this one because I thought you were looking for something different.
DL: I’m glad you
showed us something different. Please continue.
KH: I’d never not
trade a stock because the ADX wasn’t above x or some other indicator wasn’t
above y. I just use this scan as a starting point. And then up the parameters
from there.
DL: Kevin, you seem
to focus on trades around the 200-day moving average. Is there a reason for
this?
KH: A lot of times,
you’ll see institutions come in around the 200-day moving average. Also, at
these levels you’ll often see analysts upgrades. Therefore, when a stock is near
this level it often can provide daytrades, short-term trades and longer-term
position trades.
DL: You’ve showed
that this scan can be useful for finding stocks that might be worthy of option
strategies such as straddles. The scan requires and uptrend (i.e., greater than
the 200-day moving average and “U” for DMI). Why not just buy the calls (and not
bother buying the puts)?
KH: I expect the
stock to break higher as its trend is up but by setting up a straddle, I have a
chance to make money even if I’m wrong.
DL: On the
possibility of a false or “fake out” move?
KH: Yes.
DL: The patterns you
showed on these stocks are discretionary (i.e., head and shoulders, flags,
etc.). What advice could you give to someone just starting out where these
patterns might not be so obvious?
KH: The bottom line
is that it takes experience. This is never taught. Everyone reads all the
articles, books etc., and expects to be able to come in and trade. You have to
be able to look at the same pattern five different times and know that this
time it might just work. Again, this takes experience and a good feel for
the market and stock dynamics at the time of the trade.
DL: Thank you for
sharing your insights.
KH: You’re welcome.
Conclusion
Kevin has taken a
unique approach to using the StockScanner. In this scan, he’s looking for stocks
that show up before it’s obvious to the masses. His “back door†approach
allows him to often catch stocks catch stocks before they show up on
everyone’s “radar.â€
Again, Experiment!
As we’ve stated in
previous articles, experiment! There are no “right†scans. We designed the
StockScanner to accommodate a wide variety of traders.
*which equates to
4000 in StockScanner as volume is expressed in 100’s: 4000 * 100 = 400,000.
