Is This The Start Of A New Trend?
The start of a new trend? Based on the chart
action, the answer appears to be yes. However, the tepid follow-through
yesterday still suggests that most players are not fully convinced. Based on
that, it is obvious that we have all had our hands slapped a few times too many
in recent months and are now of the “you go first†attitude. In a game where
“absolute†return is the only thing, this has been a good approach especially
when combined with favoring trades in the crosses to dampen volatility spikes.
The TIC data did little to dampen fears that the current account remains in
jeopardy, but let’s face it, this has, and will continue to be, a good jawboning
subject. Yes, it does matter, but until the market really pays attention, it
will simply be a minor irritant.Â
Oil pulled back a bit
yesterday, and as a result some of the oil related plays suffered a bit. Goldman
Sachs had a very interesting piece out yesterday regarding oil titled: Oil
Prices: What Is The Tipping Point? It was a solid piece of research that puts
the current rally in perspective. Unlike what the talking heads babble on about,
let’s look at some of the conclusions of the report.
1. The rise in oil
prices is mostly driven by the strength of demand rather than a sharp fall in
supply. This is important in two respects. First, if supply declines, then the
economy, by definition, must weaken sufficiently to cut the demand for oil to
equal the supply. Second, in contrast, when the increase in oil prices is
generated by a rise in demand, then the prospects for economic weakness are
lessened as the economic weakness itself will reduce demand and thereby reduce
the magnitude of the rise in oil prices.
2. The recent rise in oil
prices is far less (in 2004 dollars) than in previous oil prices spikes. The
price rise when the Shah of Iran fell was the equivalent of $80 bbl and a
three-fold increase during the 1973-74.
3. Gas prices rose
well ahead of the current oil price rise, thus, any further increase in gas
prices will take a much larger increase in the price of oil.
Source:Â Goldman Sachs
Ultimately there is a
price per barrel that will force the economy into a recession, however, that
price is still at higher levels than where we stand currently.
All eyes are on the Bank of
Canada today with regards to monetary policy. The market expects and has priced
in a 25 bp hike, but the accompanying statement will be key in terms of future
price direction. We established a short yesterday in AUD/CAD based on the
premise that the softer commodity prices will have more of an impact on
Australia than Canada. Technically the trade was also set-up well, but any
dovish comments will likely have a negative impact on this trade.
Meanwhile our long in NZD/USD
from Thursday is showing some signs of waning momentum. Our initial target at
.6920 has not been achieved. A break above there should allow for a move towards
.6940-60 with little reason to believe that .7000 is possible, at this time.
Technical Overview:
We still favor non-dollar
based pairs in order to dampen volatility pockets, this has served us well.
Nonetheless, we will highlight some levels on the majors.
EUR/USD:Â 1.2530-50 seems to be
providing decent near-term resistance with 1.2444 seen as the litmus test for a
break lower.
GBP/USD:Â while the pound
has gotten less ugly in recent sessions, it is of course a relative description.
Failure to move above key trend-lines and simply a poorly developed chart leaves
little edge here. 1.8030 will remain the key break out level.
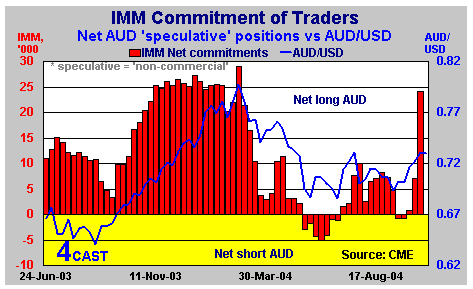
AUD/USD:Â recent strength
could not be sustained as .7260 gave way on Monday. Deeper support is seen at
.7190-.7200 which if held is a positive, but the whole structure technically is
beginning to break down. IMM data showing a large increase in speculative longs
also lends ammo to the technical break down.
Â

Source:Â 4Cast
AUD/CAD:Â nice break
through a key level yesterday, .7115 sets the stage for a run towards .7040 with
daily and weekly momentum confirming weakness.
EUR/CAD:Â a missed
opportunity here. We are typically reluctant to pick bottoms, but this was a
situation where there were signals on multiple time frames. Either way, it has
moved up 80 pips from where we had interest. Look for 1.5744 to stall this
recent move higher.
As always, feel free to send me
your comments and questions.
Â
Â
Â
