Oil Service Stocks: Line In The Sand
The
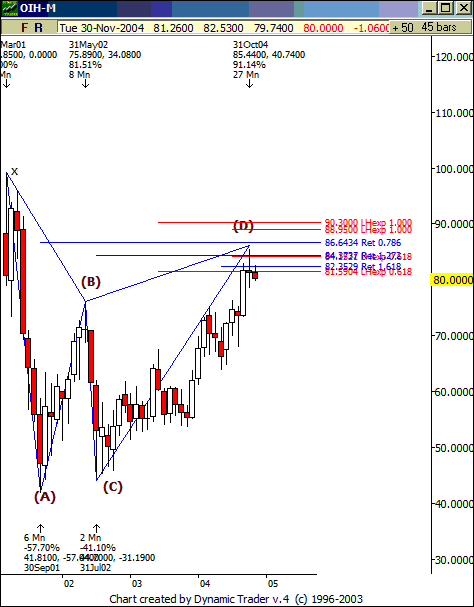
Oil Service HOLDRs (OIH) have printed a Bearish Gartley pattern on a
monthly time frame (where each bar on the chart below is a month of trading
activity). In October, OIH printed a doji candlestick to compliment our Gartley
pattern against this very large price resistance zone from 81-91. This is the
line in the sand for these Oil Service stocks. If OIH ignores this pattern and
resistance zone and is able to print a month close above 91, then this Exchange
Traded Fund is headed for the 115-130 zone quickly. However, as it stands, if we
get a move below last month’s low, this triggers a short scenario in my book
with a stop above this resistance zone. I’d be looking for a move down into the
60-65 range if this pattern plays out
.

Â
Good night!
Â
Derrik
