Profiting From TradingMarkets: How To Use The Stock Scanner–Part 4
Editor’s Note:
Each night we feature a different lesson from
TM University. I hope you enjoy and profit from these.
E-mail me if you have
any questions.
Brice
A Guide to the
Stock Scanner’s Functions and Features
By Dave Landry
In the final
part of this series, we will break down all of the functions of our
Stock Scanner. We will also show “how’s” and “why’s” behind these functions and
how you can maximize your benefits of this TradingMarkets.com feature. Finally,
we’ll answer some of the common questions regarding the scanner.
The Date Range
The Stock Scanner allows you to enter
a date range for stocks to be scanned. In most cases, you’ll probably want to
leave both “start” and “end” date to the last date in the database (the
default). This will allow you to find the latest stocks that meet your
criteria. However, for the more adventurous, you might want to broaden the date
range to find stocks that have recently met your criteria. Further, for
research purposes, you might want scan historical dates and then analyze how
these stocks have performed since those dates.
Â

Â
The Sub-Sector
If you’re just looking for a broad
list of stocks, then leave the Sub-Sector set to “All.” However, if you are
looking for the hottest stocks in a particular sector, then use the pulldown
menu (the arrow on the right) to set to whatever sector you might be interested
in.
A list of Sub-Sectors is provided
below.Â
Â
![]()
Â
Advertising
Aerospace&Defense
AirCourier Airline
Apparel/Accessories
Appliance&Tool
Audio&VideoEquipment
Auto&TruckManufacturers
Auto&TruckParts
Beverages(Alcoholic)Â
Beverages(Non-Alcoholic)Â
Biotechnology&DrugsÂ
Broadcasting&CableTVÂ
BusinessServicesÂ
Casinos&GamingÂ
ChemicalManufacturingÂ
Chemicals-Plastics&RubberÂ
CoalÂ
CommunicationsEquipmentÂ
CommunicationsServicesÂ
ComputerHardwareÂ
ComputerNetworksÂ
ComputerPeripheralsÂ
ComputerServicesÂ
ComputerStorageDevicesÂ
ConglomeratesÂ
Constr.&Agric.MachineryÂ
Constr.-Supplies&FixturesÂ
Construction-RawMaterialsÂ
ConstructionServicesÂ
ConsumerFinancialServicesÂ
Containers&PackagingÂ
CropsÂ
ElectricUtilitiesÂ
ElectronicInstr.&ControlsÂ
FabricatedPlastic&RubberÂ
Fish/LivestockÂ
FoodProcessingÂ
FootwearÂ
Forestry&WoodProductsÂ
Furniture&FixturesÂ
Gold&SilverÂ
HealthcareFacilitiesÂ
Hotels&MotelsÂ
IndexÂ
Insurance(Accident&Health)
Insurance(Life)Â
Insurance(Miscellaneous)Â
Insurance(Prop.&Casualty)Â
InvestmentServicesÂ
Iron&SteelÂ
Jewelry&SilverwareÂ
MajorDrugsÂ
MedicalEquipment&Supplies
MetalMiningÂ
Misc.CapitalGoodsÂ
Misc.FabricatedProductsÂ
Misc.FinancialServicesÂ
Misc.TransportationÂ
MobileHomes&RVsÂ
MoneyCenterBanksÂ
MotionPicturesÂ
NaturalGasUtilitiesÂ
Non-MetallicMiningÂ
OfficeEquipmentÂ
OfficeSuppliesÂ
Oil&Gas-IntegratedÂ
Oil&GasOperationsÂ
OilWellServices&EquipmentÂ
Paper&PaperProductsÂ
Personal&HouseholdProds.Â
PersonalServicesÂ
PhotographyÂ
Printing&PublishingÂ
PrintingServicesÂ
RailroadsÂ
RealEstateOperationsÂ
RecreationalActivitiesÂ
RecreationalProductsÂ
RegionalBanksÂ
Rental&LeasingÂ
RestaurantsÂ
Retail(Apparel)Â
Retail(Catalog&MailOrder)Â
Retail(Department&Discount)Â
Retail(Drugs)Â
Retail(Grocery)Â
Retail(HomeImprovement)Â
Retail(Specialty)Â
Retail(Technology)Â
S&Ls/SavingsBanksÂ
SchoolsÂ
Scientific&TechnicalInstr.Â
SecuritySystems&ServicesÂ
SemiconductorsÂ
Software&ProgrammingÂ
Textiles-NonApparelÂ
TiresÂ
TobaccoÂ
TruckingÂ
WasteManagementServicesÂ
WaterTransportationÂ
WaterUtilitiesÂ
Â
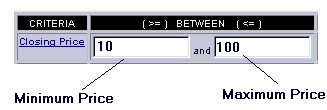
Minimum and Maximum Price
This feature allows you
to set the price range for the scan. Some daytraders/short-term traders tend to
focus on higher-priced stocks as they generally have the potential to
make larger point moves. Some position traders may consider lower-priced stocks
as they have to potential to make larger percentage moves over the
long-term. Don’t care about price? Leave it blank.
Â
Â
Minimum/Maximum
Volume
Enter the minimum and maximum volume
requirements here. The volume figures are expressed in hundreds so leave off
the last two zeros. For instance, in the example below, we are looking for
stocks with an average volume of 500,000 (5000*100) or more. Â
Many short-term traders tend to deal
with higher volume issues in order to ensure they have the liquidity to move in
and out of the stocks. Other traders may put a maximum volume figure in order
to help them find smaller-cap stocks. Â
Note: Stock Scanner does not recognize
any non-numeric characters. Therefore, do not put commas into any of the fields.
Â

Â
ADX
ADX is a measurement of trend
developed by Welles Wilder. Its calculation is based on the up directional
movement index (DMI) and down DMI. The directional movements are calculated on
a cumulative basis by comparing what range of today’s price falls outside of
yesterday’s basis. For details on how to calculate and interpret ADX, refer to
the article
Capturing Trends Though ADX under the Trader’s Lessons section.
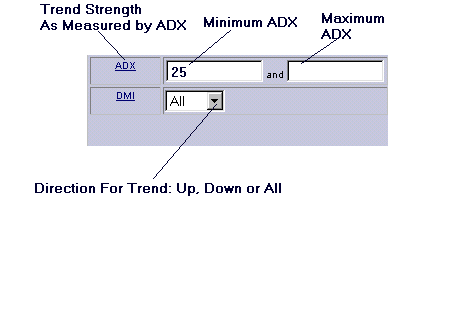
For the purposes of Stock Scanner, all
you have know is that the higher the ADX, the more the stock has been trending
as of late. “High” becomes a relative figure. In general, stocks that are
trending tend to have an ADX of 25 or higher. Keep in mind that this number will
vary with market conditions. If you are looking for trending stocks and are
getting too many produced by the scan at 25, then bump up the number to narrow
the results. If you are interested in only uptrending stocks, then set the DMI
direction to UP. Downtrending? Down. Don’t care? All.
Â
Â
Â
Price Change
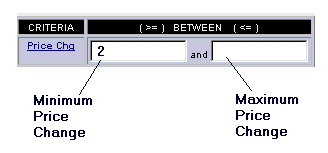
This feature is useful for measuring
one-day momentum thrusts based on price action. In the example below, we set
the minimum price change to 2. This will show all stocks that have went up $2 or
more based on date of the scan.
Â
Â
% of Average Volume
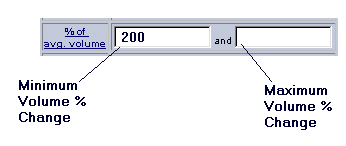
This is used to find stocks that are
trading above (or below) their average volume. Many view volume as the fuel for
a stock’s rise (or fall for short sellers). In the example below, Stock Scanner
would produce all stocks that traded at least twice (200%) the average volume on
the date of the scan.
Â
Â
Â
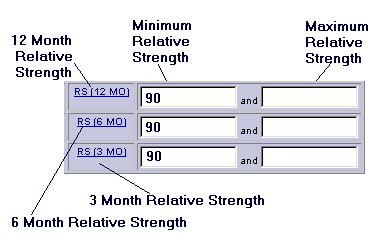
Relative Strength
Relative Strength is a ranking of how
well the stock has performed over the given period. For instance, a stock with
a RS of 99 has outperformed 99% of all other stocks over that time frame. The
widely used RS (i.e., published in newspapers) is based on a 12-month period.Â
This long-term RS is great at finding stocks in longer-term trends but may not
reflect more recent market action. For instance, suppose a stock is up 500% for
the year but then begins a sharp drop, say 50%, over the next few months. This
stock will still have “outperformed” most stocks by still being up 250% for the
year but will have under-performed most stocks on a shorter time frame. In
order to help compensate for this anomaly of longer term RS, we have also
included a three-month and six-month RS. Â
For example, the scan below would
provide a list of stocks that have outperformed 90% of all other stocks on a
three-, six- and 12-month basis.
Â
Â
Â
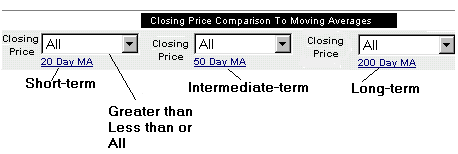
Closing Price
Comparison To Moving Averages
As you know, a moving average is the
sum of a stock’s closing price divided by the number of days. Here we provide
the ability to select stocks that are above (or below) their 20, 50 and 200-day
moving averages. This helps to find stocks that are in short-, intermediate- and
long-term trends as measured by their averages. For more on moving averages, see
the articles under
Trader’s Lessons.Â
Â
Â
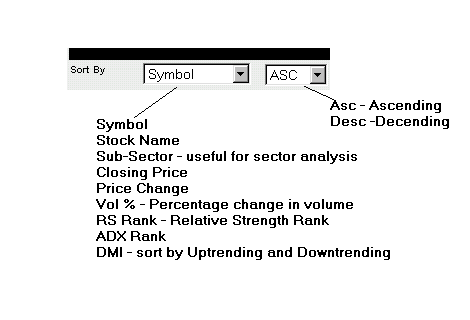
Sort By
Once we get our parameters punched in,
we need to decide how we want the results displayed. If you are just looking for
a list of stocks, you probably want to have them sorted by the symbol. However,
if you are scanning for stocks based on some other criterion, you might want
them sorted based on those criteria. For instance, if you are scanning for high
ADX stocks, you probably would want to sort on ADX and chose “Desc” so the
highest ADX stocks would be shown first. For high percentage volume scans, you
would want to sort by Vol % and so on and so forth.
Â
Â
Start/Clear
Once you get all your fields set to
your liking, hit “Start Search” to run the scan. Want to start over and try
another scan? Hit “Clear Fields”.
Â

Â
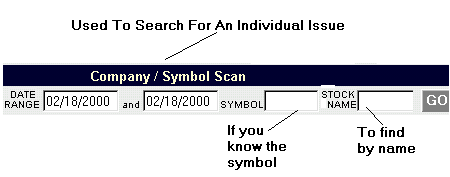
Find My Stock Only
Suppose you are only interested in an
individual issue. Leave all of the above fields blank and simply enter the
stock symbol and hit “GO”. Don’t know the stock symbol or exact name? Enter as
much as the stock name as you know and the Stock Scanner will find the closest
matches.
Â
Â
Â
The Results
Once you hit start (or go for an
individual issue), the Stock Scanner will process for a few seconds up to a
minute or so depending on complexity of the scan. It will then produce a list of
stocks based on the criteria you selected above. For your reference we have
included many of the above statistics in the results table. These include:Â the
date, symbol, name, sub sector, price, change in price, 50-day average volume,
3-6-12 month RS, DMI direction (Up or Down), ADX, Greater Than (or less than) 50
day moving average, Closed in Top (T) or Bottom (B) 25% of the daily range.
With the exception of Closed In
Top/Bottom range, these statistics are described above. The Close in T/B 25% of
range is useful to the short-term trader who is interested in how well (or
poorly) the stock closed on the day of the scan. For instance, suppose a stock
had a high of 104 and a low of 100 giving it a range of 4 points. If the stock
closed at 103 or higher, it would have closed within the top 25% of the range.Â
If the stock closed at 101 or lower, it would have closed at the bottom 25% of
the day’s range (25%*4=1, add 1 to the low for bottom 25% or subtract 1 from the
high for top 25%).
We also include “C” and “Z” hot
links. Clicking the “C” will bring up a chart of the stock. This chart can be
customized for various time frames (intraday, daily, weekly, etc.). Also,
several indicators are provided.  Clicking the “Z” will bring up a Zacks
Company Profile which includes a company description, links to related stocks
in the industry and an earnings calendar.
Summary
As you can see, the Stock Scanner is a
very powerful and flexible tool. There are no “right” or “wrong” ways to use
it. If you are looking for stocks in strong trends, you might scan for stocks
with high three-, six- and 12-month RS readings. If you are looking for stocks
up big on big volume, then put in a large price change combined with a large
percentage change in volume. If you are looking for stocks in strong downtrends
(to short), use the ADX and down DMI. These are just a few of the thousands of
combinations available.Â
Q and A
Below we have provided some recent
questions and answers regarding Stock Scanner.
Q: I’d like to
look at all stocks in a given sub-sector. Can I do this with Stock Scanner?
A: Absolutely, set the sub-sector to
the sector that you are interested in and leave all other fields blank.
Q: Why would one
scan for low ADX stocks?
A: Some look for stocks that may be in
the early phases of trend, low volatility, basing etc. For more information
here, refer to part 3 of our Stock Scanner series:
How Kevin Haggerty Uses Stock Scanner.
Q. Why use ADX
when RS is available?
A: Different people measure trend in
different ways. Also, RS is a measurement of strength not weakness. Therefore,
ADX (with down DMI) would likely be more useful when searching for candidates to
sell short. In other words, these stocks would likely be in downtrends versus
simply being outperformed by stronger stocks.Â
Q: Why use the
scanner? Why not just use the indicators on the site?
A: When we created the indicators for
the site, we tried to encompass as many traders as possible: breakout traders,
momentum traders, short sellers etc. However, we soon discovered that many had
their own personal criteria and desired “custom” scans. Therefore, we created
the Stock Scanner which allows for virtually unlimited combinations.
Q: Shouldn’t the
close above/below moving averages always be the same (i.e., up for longs, down
for shorts)?
A: Not necessarily, you could search
for stocks in pullbacks by requiring them to be above the 50- and 200-day moving
averages but below the 20-day moving averages.
Q: I typed in
500,000 for minimum average volume and get an error.
A: Do not use commas in any of the
fields. Also, volume is measured in hundreds. Therefore, in your example, you
would leave off the last two zeros and the comma. In other words, for 500,000
shares average volume, enter 5000 (which equates to 5000*100) in the minimum
volume field.
Q: I’m just
getting started, can you give me some example scans?
A: Sure, kick on “Demo Scans” on the
Stock Scanner page. Then, click “Start Search”. Also, read the other three
parts of this series for scans from myself and Kevin Haggerty under
Trader’s Lessons.
Q: What’s the
best scan?
A: It all depends on your trading
style. If you are a momentum trader, you might want to scan for only those
stocks that show high RS for three-, six- and 12-month periods or high ADX/DMI
UP stocks. If you are looking for stocks to short, you might want to try high
ADX/DMI Down. If you are looking for pullbacks, you might look for strong
stocks as measured by ADX or RS and are also trading below their 20-day moving
average. Also, Kevin Haggerty has shown that you can also find opportunities in
stocks that are showing low trend characteristics (i.e., low ADX).
Therefore, the best scan for me might
not be the best scan for you. Start with the scans we have provided, thenÂ
EXPERIMENT to find what works best for you.
Q: Is Dave
Landry the man?
A: Definitely.
