Understand This ONE Concept…
Bullet
Dodged
I am no fan of either major
candidate, but it should be clear to investors that from a market-reaction
standpoint, the market considers Kerry’s loss as dodging a bullet of sorts.Â
Under Kerry the following taxes were set to be hiked:Â Capital gains (the
stupidest tax on earth that should be 0% in any economically sane nation) from
15% to 20%;Â Dividend taxes from 15% to 40%;Â Highest Income Tax Rate from 35%
to 40%;Â Middle Income Tax Rate from 25% to 28%;Â Lowest Income tax Rate from
10% to 15%;Â Per Child Credit set to drop from 1,000 to 500;Â Marriage Penalty
Tax to be reinstated; and the Death Tax in 2010 from 0% to 55%. My comment on
the election is that hopefully Democrats will learn a few things. One — that
their candidate selection process is badly skewed toward favoring liberals that
are too far away from the center of America. Two that selling an elite New
England liberal to middle America is difficult. And most importantly, that
it is nearly impossible to win when you tell the American people that you are
going to raise taxes.
It is important for investors to
understand what the liberal media and establishment in Washington DC clearly
don’t — tax cuts do not increase deficits, they almost always decrease
them by raising government revenues a couple years down the road in response to
a stronger economy. That does not mean that if we get a tax cut deficits don’t
rise if we also get a massive spending increase. But the record is VERY clear
and consistent, not only in the US, but in more than 30 examples of other
countries globally.Â
Kennedy was the first big tax
cutter post WWII and the first supply-sider. In many ways his fiscal policy was
more supply-side than Reagan’s. The first year government revenues did drop.Â
But the next six government revenue rose at the highest clip in many years and
we had the strongest economic growth since before the depression. Kennedy
(Unlike Reagan and Bush II) helped keep spending down as well so that the
increase in government revenue from tax cutting also cut the deficit and led to
a large surplus.
The next big tax cutter was
Reagan. The media loves to distort the figures to make it look like Reagan’s
tax cuts had something to do with Reagan’s higher nominal deficits. They
didn’t, and the clear indicator of that is to look at government revenue.Â
Government Revenue from taxes in 1980 were 956 Billion according to OMB data.Â
Then we got essentially a 5% tax cut in 1981, a 10% tax cut in 1982, and a 10%
tax cut in 1983. In 1984 following the final tax cut, revenues did drop, but
only 0.6% or 5.4 billion. Then revenues exploded — up 6.4% in ’85, 2.26% in
’86, 8.1% in ’87, 3.16% in ’88, and 5.11% in 1989, ending at $1,213.1 billion.Â
Taxes effect only government revenues directly, and government revenues
generally drop a bit the first year or two and then rise substantially following
a supply-side tax cut. What made the deficit go up in Reagan’s term (and
actually as a percentage of GDP the deficit didn’t rise during the Reagan years
though it certainly did nominally) was not the tax cuts and its effect on
revenue, it was massive spending increases. But at least these massive spending
increases were accompanied by the strongest economic growth since the Kennedy
tax cuts in America, because the people got to keep more of the money and invest
it in the economy.
The track records of tax cuts in
New Zealand, Chile, Iceland, Ireland, much of Latin America, much of Asia, have
all been extremely similar. Tax cuts nearly always RAISE REVENUES down the road
one-three years as the increase in economic growth rates that follows them leads
to higher government revenue — a smaller piece of a larger and growing pie.Â
And, perhaps more importantly, tax cuts nearly always lead to higher growth
economically.
Why does Washington and the
liberal-biased media continue to insist that tax cuts increase deficits? Tax
cuts accompanied by spending increases will increase deficits ala Reagan and
much more prominently, Bush. In addition, the use of Static economic models in
projecting the effect of tax policy is disastrous, yet this is what government
uses. A tax cut improves economic growth, and it is this improvement in
economic growth that ultimately usually leads to higher revenues despite the
lower tax rate. But static models assume that the tax change has NO EFFECT on
the economy, and thus they always project lower revenues despite the fact that
empirical and historical evidence is opposite. Static models also naturally
project that every tax increase will increase government revenues, because they
also do not take into account the fact that higher taxes retard future economic
growth. In fact, very few tax increases have raised government revenues both in
the US and globally for long.
Why the diatribe? It is very
critical for investors to understand these facts in the period ahead, especially
if Bush really does try to make tax reform a central issue of his second
administration. The only way that the US stands a chance of ultimately standing
up to Chinese competition and growth over the long-run is to adopt a competitive
tax system. Right now the US has one of the highest cost tax systems on earth
that is more complicated than any Sadist on earth could have individually
designed. It is a disaster comparatively. Tax simplification and lower, more
competitive taxes on a global basis are critical to the US maintaining peak
economic strength and to continuing to produce high-paying jobs for US citizens.
A strong-as-possible economy is also key to being able to best address the huge
retirement funding gap and the break-down of our socialist policies related to
medical care as well.Â
Despite huge deficits and an
unending war abroad, the US still has a chance to start putting its affairs in
order and meet the challenges of the baby-boom retirement potential disaster.Â
What is needed is tax reform (flat tax or sales tax) and further tax cuts,
massive spending cuts and privatization of retirement and medical care, along
with a substantially reduced role of government in society at nearly every
level. This will be very difficult politically. But investors need to
understand what is at stake long-term. Not addressing these problems will
ultimately usher in a continued secular bear market in stocks and an economy
that could make the 70’s look like a picnic.Â
Yet in the intermediate-term,
the bottom we suspected was put in place off of the late Oct lows, is leading to
a new leg up that we believe will eventually take every index to new highs.Â
This is not a wildly broad-based leg up, but it is catchable still we expect.
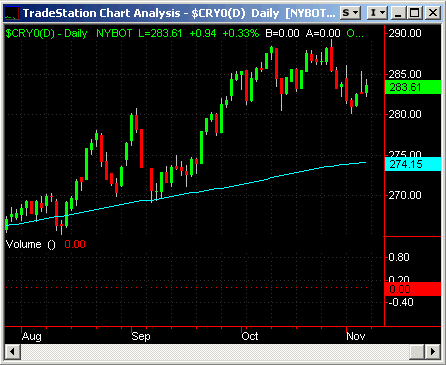
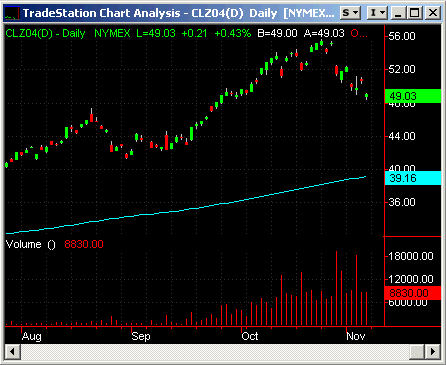
Oil prices are falling back, the dollar is weakening, and we expect Greenspan to
sound less hawkish soon, despite a probable one more rate hike. The terrorist
high-risk period will end in just a week or so, and the US getting through the
election is a big sigh of relief. Â

We continue to expect that
investors will have to stay very nimble and watchful to make decent returns and
avoid the potential pitfalls during this historic period, though a slightly
better period may be here for a quarter or two. We will continue to try to
understand and profit from the environment whatever it is and whatever
develops. We continue to strongly believe now more than ever that investors
must monitor global trends in a wide variety of asset-classes to be able to
profit strongly from the major waves that are developing.

Our favorite sectors/countries
continue to be South Africa, Rails and Transports, Software, Belgium and
Austria, Eastern Europe and Russia, value/growth and mid-cap value, Europe and
world/US, Indonesia, and gold.

Our model portfolio followed in TradingMarkets.com with specific entry/exit/ops
levels from 1999 through May of 2003 was up 41% in 1999, 82% in 2000, 16.5% in
2001, 7.58% in 2002, and we stopped specific recommendations up around 5% in May
2003 (strict following of our US only methodologies should have had portfolios
up 17% for the year 2003) — all on worst drawdown of under 7%.  This did not
include our foreign stock recommendations that had spectacular performance in
2003.Â
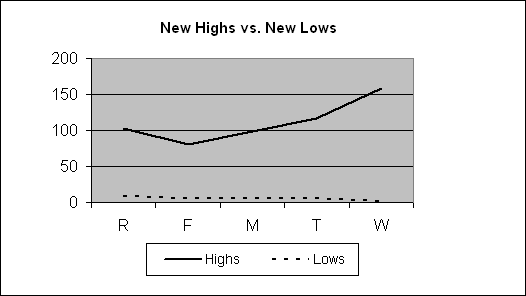
This week in our Top RS/EPS New Highs list published on TradingMarkets.com, we
had readings of 103, 81, 99, 117, and 159 with 29 breakouts of 4+ week ranges,
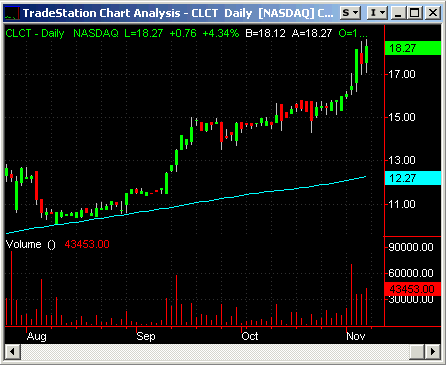
no valid trades and one close call in CLCT. Breadth is expanding again and more
close calls would be a call to add some long exposure. Position in valid 4+
week trading range breakouts on stocks meeting our criteria or in close calls
that are in clearly leading industries, in a diversified fashion. This week,
our bottom RS/EPS New Lows recorded readings of 9, 5, 5, 6, and 2 with 3
breakdowns of 4+ week ranges, no valid trades and no close calls. We’re still
not getting a lot of trading signals in valid breakouts, though the environment
is improving slightly on the long side — let’s see if this holds up and we can
get some follow-through on the rally attempt.

For those not familiar with our long/short strategies, we suggest you review my
book
The Hedge Fund Edge, my course “The
Science of Trading,”
my video seminar, where I discuss many
new techniques, and my latest educational product, the
interactive training module. Basically,
we have rigorous criteria for potential long stocks that we call “up-fuel,” as
well as rigorous criteria for potential short stocks that we call “down-fuel.”
Each day we review the list of new highs on our “Top RS and EPS New High List”
published on TradingMarkets.com for breakouts of four-week or longer flags, or
of valid cup-and-handles of more than four weeks. Buy trades are taken only on
valid breakouts of stocks that also meet our up-fuel criteria. Shorts are
similarly taken only in stocks meeting our down-fuel criteria that have valid
breakdowns of four-plus-week flags or cup and handles on the downside. In the
U.S. market, continue to only buy or short stocks in leading or lagging
industries according to our group and sub-group new high and low lists. We
continue to buy new long signals and sell short new short signals until our
portfolio is 100% long and 100% short (less aggressive investors stop at 50%
long and 50% short). In early March of 2000, we took half-profits on nearly all
positions and lightened up considerably as a sea of change in the
new-economy/old-economy theme appeared to be upon us. We’ve been effectively
defensive ever since, and did not get to a fully allocated long exposure even
during the 2003 rally.
We continue to believe that we’re in a correction to a difficult but playable
rally that clearly entails unusually high risk and significant shock-risk. Only
experts should tread much here. Traders should know how to mix outright longs
with relative value plays that feature the strongest sectors over the market as
a whole or over weaker sectors. Even then we strongly suggest less than normal
allocation. Soon elections in many countries worldwide will be over and
terrorist shock risk will be reduced some. As the economic situation in both
China (now the dominant economy on the globe?) and the US clarifies, better odds
opportunities will develop. Wait for the good odds with most of your capital.Â
Mark Boucher
