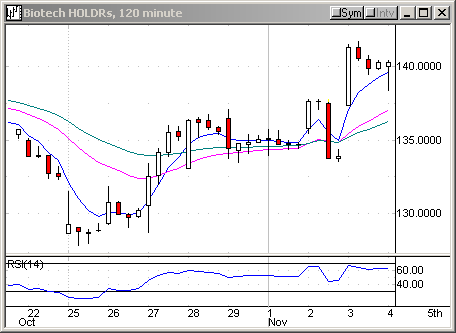
This Is Why You Should Try A 120-Minute Chart
If you are aÂ
hyperactive trader, your main weapon is the 1-minute chart. As you
know, shorter time frame charts are more prone to pick up noises than longer
time frame charts. Action-seekers cannot imagine doing this, but I suggest you
to try a 120-minute chart.
11:19:29
(From TradersWire)
Biotech HOLDRs (BBH)
is reversing to the up side. Long BBH above 140.45. Target is near 141.75. Risk
0.5-0.75. BBH is at 140.40, up 0.04.
Before posting the alert, I checked the daily, 5-, 30-, and 120-minute charts,
and I especially liked the 120-minute. Look at the chart below. BBH formed a
bullish tail right at a rising trendline, and it looked ready to resume the
uptrend. Shortly after 12:30, we were able to take a partial profit.
12:34:15
Follow up on the 11:19 story (BBH)
The stock has covered our initial risk. Sell half of your position, and raise
your stop to breakeven or higher. BBH is at 141.03, up 0.67.

Have a nice afternoon session!
If you have questions, feel free to mail them to me.
