This Is One Way To Use Daily Charts In Daytrading
I was planning to buy
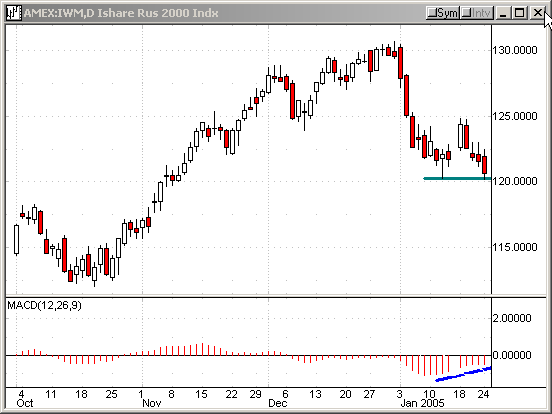
IWM (iShare Russell 2000) this morning. Look at the daily chart below
(as of yesterday’s close). The issue closed just above the January 12 low.
Notice, the MACD histogram has been slowly improving.

10:09:34 (From TradersWire)
![]()
|
Action |
Symbol |
Order Type |
Setup |
Stop |
 Target |
Current Price |
Posted By |
|
Buy |
IWM |
buy at MKT |
pullback |
121.30 |
122 |
121.63 |
TK |
I guess many traders were thinking like I was.
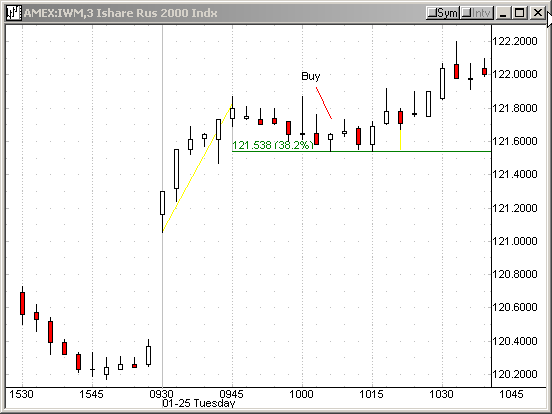
IWM gapped up at the open. That messed up my trading plan. I was forced to watch
the stock for awhile. After confirming a successful test of the 38.2%
retracement level (from intraday low to intraday high), we bought it at the
market.
10:20:48
Sell half to lock in 25 cents. Move stop to breakeven.

If you have questions, feel free to mail them to me.
