Today’s Trading Lesson From TradingMarkets
Editor’s Note:
Each night we feature a different lesson from
TM University. I hope you enjoy and profit from these.
E-mail me if you have any
questions.
Brice
How To Use TM’s
Indicators: Strongest And Weakest Sectors Of The Past Five Days
By Daniel Beighley
If you read
This Week’s Battle Plan each week, you should be familiar with the
To Do List recommended by Larry Connors. This lesson will focus on the
third step of the list, using the
strongest/weakest
sectors:
1. Begin with the
Nightly Market Bias page.
2. Look at the
Proprietary Momentum lists.
3. Then move onto the
strongest/weakest
sectors for the past 5 days lists.
4. If you are
looking for a stable of good names to focus on, both to the long side and to the
short side,
Mark Boucher’s lists
are a great place to start.
5. End each evening
by looking at the nightly TradingMarkets Reports on the
home page.
TM’s
Strongest And
Weakest Sectors Of The Past 5 Days list is updated every night by 7:30
and is designed for traders to easily identify which sectors money is flowing
into or out of. Following the lists can be extremely informative for all trading
strategies. Daytraders, swing traders and intermediate-term traders alike
benefit from keeping up to date with sector strength and weakness. Making the
analysis part of your trading routine will ensure that nothing slips past you,
as you will always be alert to shifts in the market. As mentioned in
This Week’s Battle Plan, when you see a sector moving in a direction
it’s not supposed to be moving, it is an opportunity to act counter-intuitively.
This is just one of many uses of the sectors lists.
Every trader has a certain style, and there is no
one right way to do everything. Analyzing sector movement is best from the
perspective of a top-down approach, and here are some of its typical uses:
Daytraders can easily identify the quickest-moving sectors and know which ones
have the strongest trends for big intraday moves. Swing traders know where to
select strength and weakness for moves that may last anywhere from a couple of
days to weeks. Intermediate-term traders can stay on top of the leaders and
laggards and monitor where institutional money may be strategically flowing in
or out of.
As Dave Landry illustrates in
Dave Landry on Swing
Trading that traders need to set up in stocks that show the most
immediate potential. When using the top-down approach, sector analysis is a
filtering tool used to screen for the best candidates. Traders are best
positioned when the momentum of a stock, as well as the sector, are in tune.
Selecting the strongest stocks in the strongest sectors, as well as the weakest
stocks in the weakest sectors, will keep a trader where the action is no matter
what the strategy.
Keep in mind that sectors have more influence on
an individual stock than the overall market. Strong-trending sectors may also
move against the overall market, which can be important to identify, as some
setups may have less obvious potential or appear to be better than they really
are. The same is true of sub-sectors, which can deceive you if you don’t have a
good understanding of how they are trending. Following the lists every night
will ensure you know exactly where things stand.
An example of using the
Strongest Sectors of the Past 5 Days
list would be if one night you notice a sector show up on the list
at the number 5 position. This may be your first indication that money is
flowing in. In the next few days or even weeks, you may notice the sector move
up a position or two. This is further indication of a sector’s strength. Early
warning that a sector is on the move can be very valuable when it comes to
pinpointing an appropriate time to enter or exit a trade. It is best to use some
form of technical analysis to identify a “trigger,” and depending on your
strategy, it may be classic support and resistance zones, pullbacks, chart
patterns, or more involved Fibonacci and Elliot Wave principles.
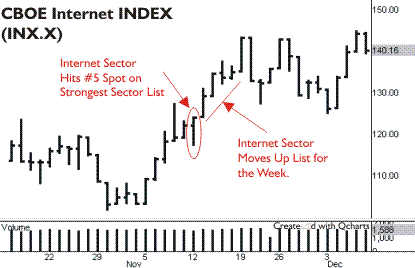
Below is an example of the Internet Index ($INX.X)
showing up on the
Strongest Sectors of the Past 5 days list:
Once the sector is identified as having
potential, a screen for candidates is done by looking for any technical setups
that may prove profitable. Below we see a pullback with Yahoo! (YHOO):

Yahoo! represented a pullback play
just as the Internet sector showed up on the
Strongest Sectors of the Past 5 Days list. The next day the stock
triggered with a gap up, resuming its prior trend. The trend was reinforced each
day as the Internet sector remained or moved up on the list. A good exit
strategy here would have been to watch for a trend change on Yahoo!’s chart
pattern and to have kept an eye on the sector strength lists for any changes.
The Internet sector began to reverse after a week, and simultaneously, Yahoo!
began to pullback. Once the stock traded below its prior day’s range, a stop
should have been hit to lock in a profit.
This was just one example of how the
sector lists can alert you to potential setups. Dave Landry has perfected
pullback strategies, and any swing trader would do him or herself justice by
educating themselves with Dave’s excellent methods for high-probability entries.
Daytraders would have used the
information above to be on the watch for Internet stocks setting up for powerful
intraday moves. In the same way swing traders use the
Strongest And
Weakest Sectors Of The Past 5 Days lists to filter for candidates,
daytraders do as well, but only for the purpose of capturing the moves intraday.
The idea is to spot stocks on the move, and by familiarizing yourself with where
the sectors are stacking up against one another, you will always know where to
look.
One of the advantages of following sectors is
that technical analysis of an entire sector will be a lot smoother because there
is less volatility than in individual stocks. Institutions often exhibit
behavior in which they will move money out of a sector and into another. Many
traders use market-timing methods to capture these trends. With mutual funds and
exchange traded funds (ETFs), it is possible to trade the sector as a whole.
When you as a trader make it a routine to watch the
Strongest And
Weakest Sectors Of The Past 5 Days lists you will always be on top of
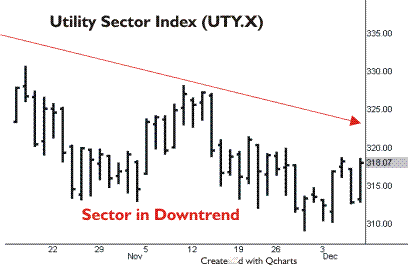
these moves. Below is an example of how money can shift.
Here we have the Utility Sector ($UTY.X),
which was routinely on the
Weakest Sectors of the Past 5 Days list for the past couple of months:
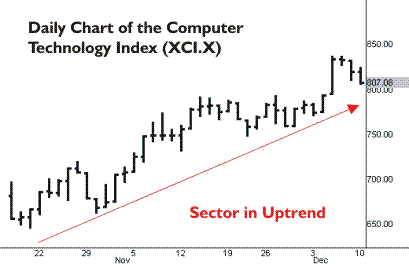
In the same time frame as the example above, the
Computer Technology Index $XCI.X>$XCI.X) was a member of the
Strongest Sectors of the Past 5 Days list for the past couple of months:
When a trader sees a certain sector begin to show
up on the list, he or she then screens for potential entries. Routinely doing
this ensures that virtually no potential moves will slip under the radar. To
best take advantage of trends in a sector, a trader should use forms of
technical analysis as triggers for entry. Because timing sectors requires a time
frame of usually at least a couple of months, you will want to look at weekly as
well as monthly charts for indications of a potential shift. Trendline breaks,
moving average crosses, and play-outs of common chart patterns have proven to be
effective indications of shifts in money flow. Keeping an eye on the
Strongest And
Weakest Sectors Of The Past 5 Days list is an excellent way to tune in
to these potential triggers.
Following the sectors’ action is also a
crucial aspect for intermediate-term traders. People familiar with the IT
strategy know how important it is to have the trend of a stock confirmed by
other stocks in a sector. Because sector movement usually has a direct influence
on individual stocks, keeping up to date with this list gives traders a heads up
for potential shifts. For example, if you have your eye on a stock that meets
your fundamental and technical requirements, you will want to be sure that the
sector it is a member of is also exhibiting similar technical behavior. In a
weak market, there may be situations where you have a great candidate that
breaks out of a nice base, but fails because the sector it is a part of does not
confirm the price action. IT traders need to stay alert to anything that could
potentially thwart a good stock’s progress.
Traders should also keep in mind that the
weighting for each stock in a sector can vary. The bigger the company, the more
money it will take to move the stock, so it will be allocated with a heavier
weighting on the list. For example, Microsoft represents the biggest company on
the Nasdaq 100, so it is given a 10.77% weighting compared to a smaller company
like McLeodUSA Incorporated, which is only given a 0.02% weighting. This
information can be helpful in understanding why a whole sector may have moved
more than an individual stock. Typically, the stocks in a sector will move in
lockstep fashion, but one great day for Microsoft may not always be true for the
rest of the sector.
To sum things up, TM’s
Strongest And
Weakest Sectors Of The Past 5 Days lists provide critical information
for complete market analysis. No matter what the trading strategy, these lists
will alert a trader to “hot spots” in the market action. By routinely following
the lists, a trader will ensure that no big money shifts in the market slip
under the radar. As mentioned earlier, this is just one of the components in
TM’s To Do List that can help you stay profitable and on the way to
achieving your trading goals.