Here’s One Way To Use The Previous Day’s Closing Price
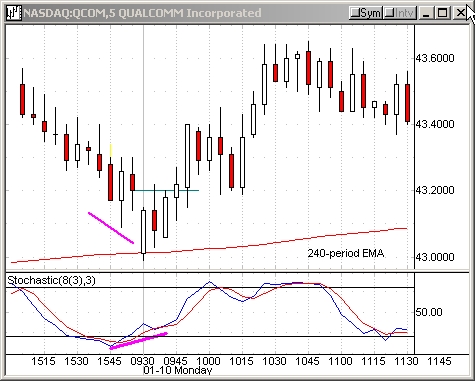
QUALCOMM Inc (QCOM)
gapped down and opened right at the 240-period EMA on the 5-minute
chart. In other words, QCOM started the day exactly at its 20-period EMA on its
60-minute chart. I was considering to buy the stock immediately, but decided to
observe it a few minutes.
09:41:49 (From TradersWire)
![]()
|
Action |
Symbol |
Order Type |
Setup |
Stop |
Current Price |
|
Buy |
QCOM |
Buy stop at 43.21 |
Opening reversal |
42.98 |
43.13 |
QCOM filled the gap, but my question
was could it break above the gap? The stochastic was showing a positive
divergence, so I placed a buy stop just above Friday’s closing price.
09:51:55
Follow
up on QCOM
Sell half to capture a 15-cent gain. Raise stop to breakeven.
Have a productive afternoon session!
If you have questions, feel free to mail them to me. Â