Use This Moving Average In Your Trading
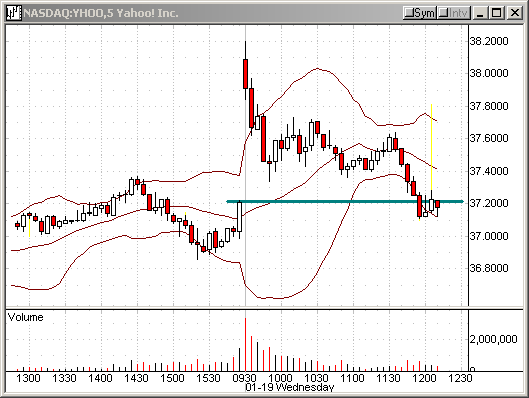
Yahoo (YHOO) reported
its Q4 earnings of 13 cents a share. It was 2 cents better than the
Reuters Estimates consensus. On this news, the stock gapped up above the upper
Bollinger Band at the open. As you can see below, YHOO lost the momentum and
slipped below the lower boundary of a gap zone.

10:47:33 (From TradersWire)
![]()
|
Action |
Symbol |
Order Type |
Setup |
Stop |
Target |
Current Price |
Posted By |
|
Buy |
RIMM |
buy at MKT |
76.03 |
76.55 |
76.27 |
TK |
I’m not going to say all traders, but most of
traders use moving averages on their intraday charts. If you are using the
5-minute chart, pay attention to the 240-period EMA (One of Kevin Haggerty’s
favorites). Why the 240-period? Because, it indicates the 60-minute chart’s
20-period EMA on the 5-minute chart.
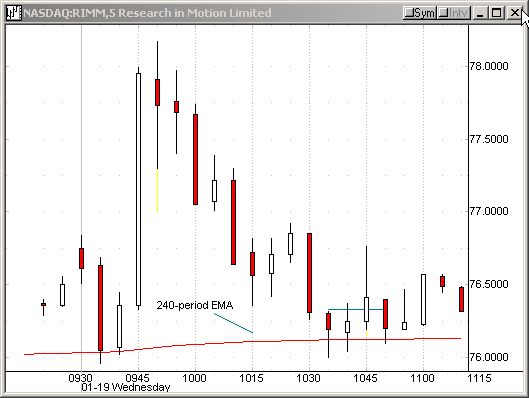
As you can see, around 10:40, the stock tested the 240 EMA twice and managed to
close above the line. It was a potential bottom. We bought RIMM at 76.27. A few
minutes later, the issue hit our target.
10:52:41
Follow up on RIMM
Sell half to lock in 25 cents. Move stop to breakeven.

If you have questions, feel free to mail them to me.
Â
Â
