Today’s Trading Lesson From TradingMarkets
Editor’s Note:
Each night we feature a different lesson from
TM University. I hope you enjoy and profit from these.
E-mail me if you have
any questions.
Brice
Combining ADX with
RS to Find Intermediate-Term Trades
By Loren Fleckenstein
As an intermediate-term trader, I
don’t rely on mechanical indicators to time my trades. For long trades, I scan
for high relative strength stocks. For short trades, I scan for low relative
strength stocks. Then I manually eyeball the charts for valid patterns and pick
my entries based on breakouts.
However, while I don’t use indicators
to time trades, I’ve found them useful in refining my database scans for basing
stocks. One useful technique is combining low Average Directional Movement Index
(ADX) readings with high RS scores for long trades or with low RS scores for
shorts.
I got this idea from Larry Connors,
who suggested a high RS/low ADX combo could smoke out stocks that have displayed
powerful performance relative to general market, then have moved into narrow
trading ranges.
Not all the stocks generated by the
screen will pass muster when I inspect their charts. If you use this screening
approach, either on TradingMarkets’
StockScanner or some other proprietary software or database, be prepared to
sift through plenty of chaff in order to get to the wheat. However, I’ve always
found this to be the case. Intermediate-term momentum trading is discretionary
trading. No scan will relieve of you of the necessity doing plenty of homework
to zero in on the best possible trades.
Relative strength measures of a
stock’s performance vs. a universe of stocks or an index such as the S&P 500. In
the case of database scans, most RS searches use a percentile system. A stock
with a six-month RS rating of 85, for instance, outperformed 85% of all stocks
in its database set or universe over the past six months. A stock with a
12-month RS of 15 has lagged 85% of its peers.
ADX measures the strength of a trend.
So a low ADX score could help locate stocks which are moving sideways. It tends
to be a lagging indicator, so you’ll get a lot of stocks that have broken higher
or lower despite their low ADX readings. Nevertheless, it can lead you to stocks
which are putting in consolidations.
By combining extreme RS scores with
low ADX scores, I am seeking stocks that have forged strong intermediate-term
uptrends or downtrends, then are pausing. Some of these will be putting in
bases.
I encourage you to experiment with
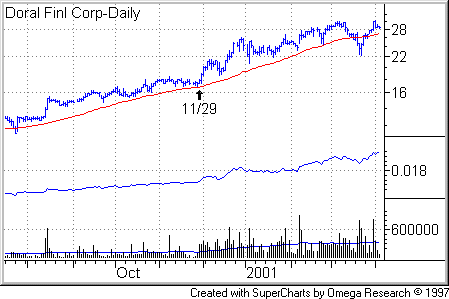
your own settings. Here are three long trades that came up on Nov. 29, 2000,
shortly before their breakouts, using a 12-month RS filer of greater than or
equal to 80, a three-month RS greater than 80 and an ADX of less than or equal
to 25. The stock should be above its 200- and 50-day moving averages. You also
can add other filters to suit your tastes in terms of average daily volume and
minimum price. I suggest excluding stocks with prices in the single digits and
daily average trade below 300,000 shares.
Dime Bancorp (DME):
12-month RS 84, three-month RS 94, ADX 13:

Doral Financial (DORL),
12-month RS 81, three-month RS 88, ADX 21:

Consol Energy (CNX):
12-month RS 83, three-month RS 89, ADX 15:

As you can see from Consol Energy,
this scan is not a timing tool, it’s a base-locating tool. The idea is to locate
bases as they are forming so that you can monitor the stock going forward as you
watch for the breakout.
