This Is Why You Should Try 15-Minute Charts In Your Trading
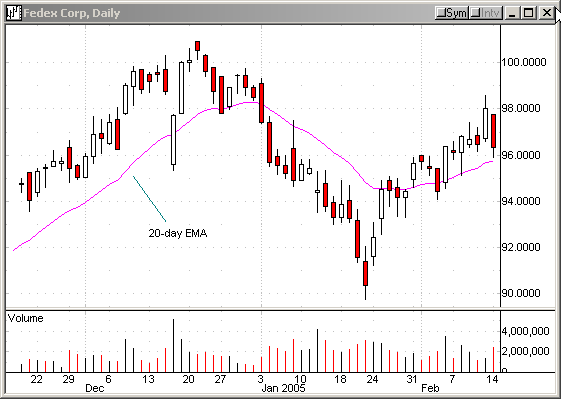
FedEx Corp (FDX), shown below, closed
poorly yesterday, but it held above its 20-day EMA. So often stocks
bounce off the 20-day EMA after pulling back from their recent highs. Â

10:26:21 (From TradersWire)
![]()
|
Action |
Symbol |
Order Type |
Setup |
Stop |
 Target |
Current Price |
Posted By |
|
Buy |
FDX | buy stop at 96.16 | 1-2-3 bottom | 95.94 | 96.50 | 96.14 |
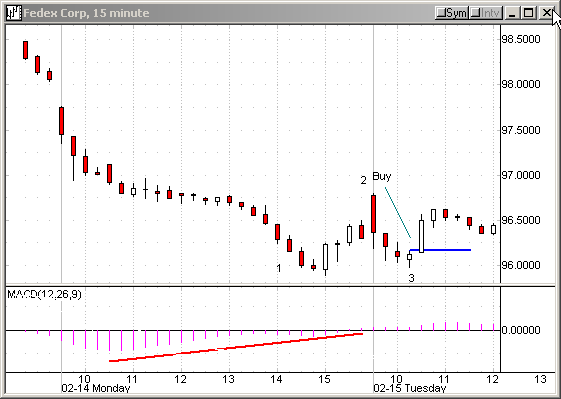
Now, let’s look at the 15-minute chart. FDX
approached Monday’s low, and it formed a 1-2-3 bottom. Notice the MACD histogram
was indicating a positive divergence. I placed a buy stop at 96.16.
10:33:47
Follow up on FDX
Sell half to take a 20-cent gain. Move stop to breakeven.

T.Kamada
If you have questions, feel free to
mail them to me. Â
