Here’s your heads up for the broad market
The major
indexes finished lower last week, as worries over inflation and interest rates
continued. Much of the weakness was seen early in the week, as the equities
markets were actually able to stabilize on Thursday and finish firmly higher
Friday. Much of the early weakness stemmed from hawkish Fed commentary. In
addition, as I mentioned last week, institutional tax loss selling was probably
behind some of the selling. Energy shares were the weakest group, while Chip
shares found some love.
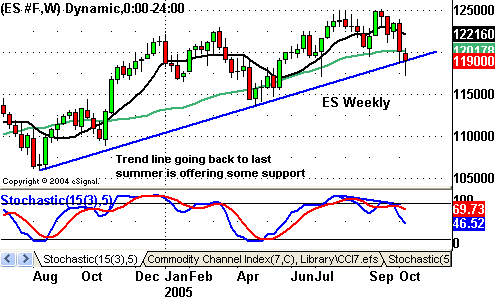
The December
SP 500 futures closed out the week with a -10 point loss, while the YM
posted a smaller relative loss of just -21 points. On a weekly basis, both
contracts posted hammers and were able to close above their uptrend lines.
Looking at the daily charts, both contracts posted a reversal and market
structure low off of Thursday’s dojis and have put their Butterfly patterns into
play. For you daily 3-Line Break followers, the ES is on the brink of
breaking long as it settled right on its Break Price of 1190, while the YM remains short with a Break Price of 10323.
Â

Â
Many of the
factors that are usually indicative of a bottom, albeit a short-term one,
presented themselves last week. Market sentiment had shifted to pretty negative
with persistent worries over inflation, the collapse of Refco
(
RFX |
Quote |
Chart |
News |
PowerRating), and bearish
reactions to decent earnings reports from Advanced Micro Devices
(
AMD |
Quote |
Chart |
News |
PowerRating) and Apple
Computer
(
AAPL |
Quote |
Chart |
News |
PowerRating). While all this was going on, Chip shares stabilized and were even
able to finish higher. Often times, Chip shares are a good heads-up for the
broad market, which was clearly the case on Wednesday.
At this
point, it’s anyone’s guess (and I emphasize “guessâ€) on whether or not a
sustainable bottom was put in a few days ago. As long as the Fed remains in
tightening mode, it’s kind of hard to believe that any rally will be anything
other than the short-term variety. It has become clear recently that the real
estate is slowing down, and the threat of further rate hikes into an excessively
leveraged real estate market presents serious risk to the entire financial
system. With energy and certain other commodities trading off their highs, the
Fed may see the light and not feel that they have to overdo it with the rate
hikes. But then again, based on past experience, don’t count on it.
Daily Pivot Points for 10-17-05
| Symbol | Pivot | R1 | R2 | R3 | S1 | S2 | S3 |
| INDU | 10259.78 | 10319.47 | 10351.59 | 10411.28 | 10227.66 | 10167.97 | 10135.85 |
| SPX | 1183.05 | 1190.65 | 1194.74 | 1202.34 | 1178.96 | 1171.36 | 1167.27 |
| ES Z5 | 1186.67 | 1194.83 | 1199.67 | 1207.83 | 1181.83 | 1173.67 | 1168.83 |
| SP Z5 | 1186.80 | 1194.60 | 1199.30 | 1207.10 | 1182.10 | 1174.30 | 1169.60 |
| YM Z5 | 10278.00 | 10339.00 | 10376.00 | 10437.00 | 10241.00 | 10180.00 | 10143.00 |
| BKX | 94.84 | 95.65 | 96.06 | 96.87 | 94.43 | 93.62 | 93.21 |
| SOX | 443.07 | 447.42 | 452.15 | 456.50 | 438.34 | 433.99 | 429.26 |
Weekly Pivots for the Week of 10-17-05
| Symbol | Pivot | R1 | R2 | R3 | S1 | S2 | S3 |
| INDU | 10255.64 | 10354.82 | 10422.30 | 10521.48 | 10188.16 | 10088.98 | 10021.50 |
| SPX | 1183.76 | 1199.33 | 1212.08 | 1227.65 | 1171.01 | 1155.44 | 1142.69 |
| ES Z5 | 1188.75 | 1205.75 | 1221.50 | 1238.50 | 1173.00 | 1156.00 | 1140.25 |
| SP Z5 | 1187.73 | 1203.47 | 1217.03 | 1232.77 | 1174.17 | 1158.43 | 1144.87 |
| YM Z5 | 10280.67 | 10383.33 | 10464.67 | 10567.33 | 10199.33 | 10096.67 | 10015.33 |
| BKX | 94.45 | 96.04 | 96.85 | 98.44 | 93.64 | 92.05 | 91.24 |
| SOX | 444.27 | 455.44 | 468.18 | 479.35 | 431.53 | 420.36 | 407.62 |
Please feel free to email me with any questions
you might have, and have a great trading week!
Chris Curran
Chris Curran started his trading career at the
age of 22 with a national brokerage firm. He combines fundamentals and
technicals to get the big picture on the market. Chris has been trading for 15
years, starting full time in 1997, and has never had a losing year as a
full-time trader.
