Here’s how to play any rally into year end
Kevin Haggerty is
the former head of trading for Fidelity Capital Markets. His column is
intended for more advanced traders. Kevin has trained thousands of traders
over the past decade. If you would like to be trained by him,
ext. 1
The market action
of the major indexes on Friday included option expiration and the Caterpillar
(
CAT |
Quote |
Chart |
News |
PowerRating)
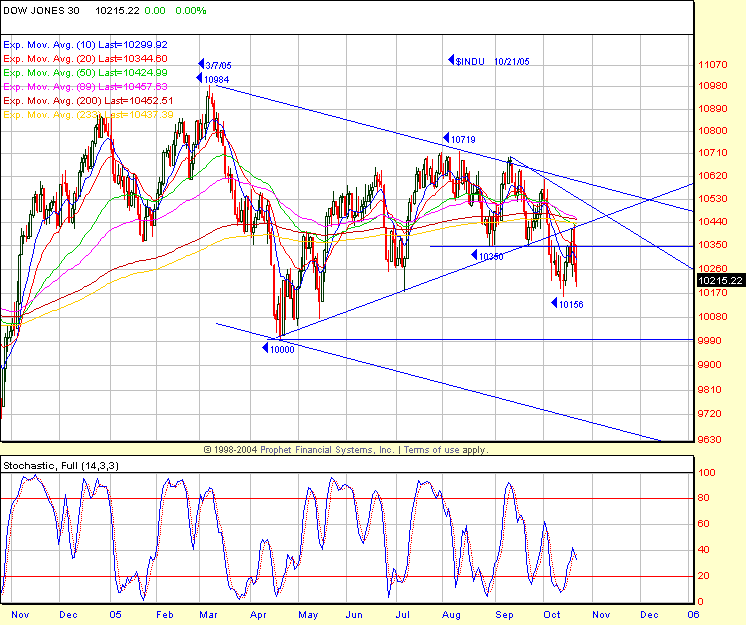
implosion, -9.5%, distorting the Dow
(
DJX |
Quote |
Chart |
News |
PowerRating)
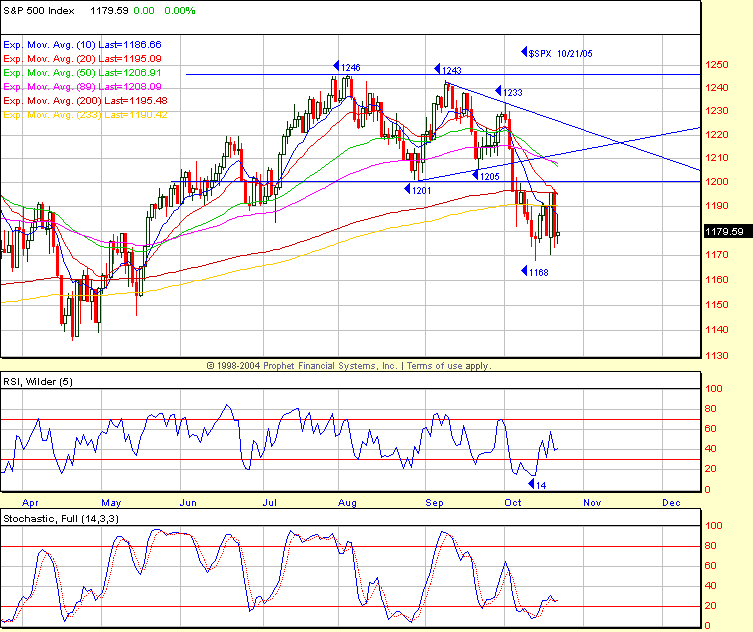
to a -0.6% close at 10,215. The SPX
(
SPX |
Quote |
Chart |
News |
PowerRating) was +0.1% to 1179.59, QQQQ, +0.6%
to 38.55 and the Nasdaq +0.7% to 2082. The internals were better than the SPX
close, with the volume ratio 60, breadth +1031 and total volume 1.85 billion
shares. The
(
OIH |
Quote |
Chart |
News |
PowerRating), +1.3% and
(
SMH |
Quote |
Chart |
News |
PowerRating), +1.1%, led the green sectors in
addition to the
(
XAU |
Quote |
Chart |
News |
PowerRating) at +2.9% and
(
TLT |
Quote |
Chart |
News |
PowerRating), +0.9%.
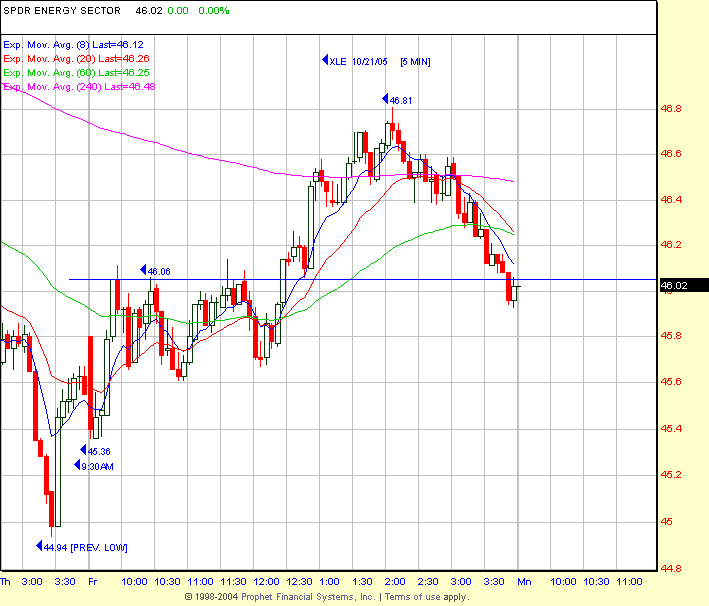
The energy sector was a primary daytrading focus
on Friday and proved to be very profitable for traders. There were many defined
contracted volatility breakouts led by the XLE above 46.06, which ran to 46.81
before reversing with the SPX and closing at 46.02. There were similar patterns
in many of the component XLE and OIH individual stocks. Due to the CAT opening
decline to 48.28 from the previous 54.02 close, the Dow got extended intraday as
the
(
DIA |
Quote |
Chart |
News |
PowerRating) took out the 10/19, 102.36 low to 101.87 by Noon. There was a
positive divergence in the momentum oscillator (8,3,3 stochastic) as the DIA hit
101.87. The inside bar reversal pattern gave traders an RST entry from 102.03 –
102.15, depending on your execution as the DIA reversed quickly, trading to
102.90, but failed and declined to close at 102.14. If you took an 11:00 AM
entry above 102.23 (w/o the positive divergence) it was stopped out at -.12 but
then the second entry more than took care of that for sure.
The energy stocks might work lower if crude ($WTIC)
drops to its 57.50, 200-day EMA level or lower to the 56 – 55 head and shoulder
measurement on the daily chart. Either way, they will remain a primary
daytrading focus because the institutions and hedge funds have become very
active at theses levels on the decline from new rally highs. The SPX and Dow
have made two runs at initial longer-term moving average resistance last week
and failed both times. The resistance levels are outlined in today’s charts and
should continue to guide the trading bias until shown otherwise. The risk of a
short-term new low below 1168.20 still remains very high before any attempt to
rally the major indices into year end. Right now, there is no real leadership
and many big-cap chart patterns remain in bear-market declines from highs in
03/05 when the Dow industrials topped out. In fact, there was more volume and
upside price moves last week in these kind of stocks so maybe the institutions
are rolling some of their core positions by buying back some percentage of these
stocks sold at higher levels and that might be a catalyst for a rally of sorts
into the last eight weeks. If that happens, there will be many lucky investors
that get another chance to sell into the higher levels.
The SPX has spent 13 days below the 1246 -1201
trading range from early July. The 1168 low put the SPX into the oversold
condition and does give the institutions a good opportunity to get a rally going
into year end. Should the 1168 low get taken out first, 1140 – 1150 is the next
stop. The longer-term moving averages (12-month EMA, 233-day EMA, 200-day
EMA) are about 1187 – 1190 -1196 and then there is the 1201 range low just above
before the index hits previous trendline resistance. A close above SPX 1201
would probably back some of the sellers off, especially going into the last
eight weeks of the year. Nevertheless, any rally into year end will be played
from the daytrading side and will only carry an index proxy position overnight
if there is a sufficient profit cushion at day’s end. Individual stocks will be
on a daytrading basis only, with emphasis on the Generals’ major winners year to
date, which is what you would expect to get marked up into year end. Both the
SPX and Dow charts are included today with the basic resistance levels to be
aware of as we start the week. The Dow went out at 10,215 and has significant
resistance from 10,350 -10,500.
The next commentary will be Wednesday. Have a
good trading day,
Kevin Haggerty


