Watch these signs of a year-end rally
A few things that I am
watching before I get too bullish after the declining October are these:
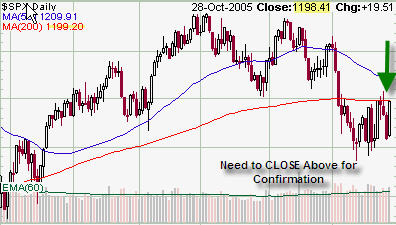
1) The S&P 500 needs to close above its 200-day
simple moving average
2) A sector or sectors need to show strong leadership
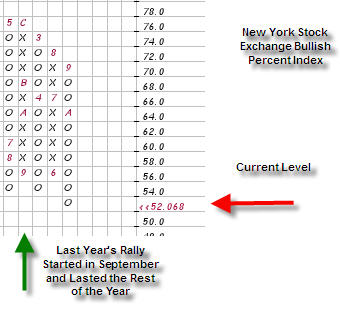
3) The New York Stock Exchange Bullish Percent needs to reverse course and start
rising instead of falling. All three do not have to necessarily happen for the
market to go up, and, they do not have to happen in any particular order for me
to become more bullish. Each of the three would mean different things for the
market.
The 200-day simple moving average for the S&P 500
is 1199.20. We crossed above that level intraday a couple of times last week,
and closed on Friday, October 28th, very close to that level. Being a
conservative trader, I prefer closes to intraday prices in order to confirm
reversals. In reality, a close of the S&P 500 above its’ 200-day moving average
should just make investors bullish about those stocks that are in the S&P 500,
particularly those with the largest market caps and therefore greatest
percentage of the S&P –
(
GE |
Quote |
Chart |
News |
PowerRating),
(
MSFT |
Quote |
Chart |
News |
PowerRating),
(
XOM |
Quote |
Chart |
News |
PowerRating),
(
PFE |
Quote |
Chart |
News |
PowerRating), etc…
However, the broader market does tend to follow
the S&P 500 and its’ movement. If those large cap stocks can get moving, the
small to mid cap stocks {which have outperformed for (at a minimum) the past
three years} are likely to be able to rally as well. That said, if the S&P 500
can close above its’ 200-day simple moving average before any sectors show
strong leadership or the New York Stock Exchange Bullish Percent reverses to
positive, then I will become bullish and perhaps buy an exchange traded fund
that tracks the S&P 500. An investor could even buy an equal weighted S&P 500
fund. A couple of those to consider are
(
IYY |
Quote |
Chart |
News |
PowerRating) and
(
RSP |
Quote |
Chart |
News |
PowerRating).

In regards to number two above, I have yet to find any sector that is showing
strong, broad based leadership. The dollar has failed at resistance and energy
stocks did rebound last week. However, energy’s relative properties continue to
weaken. On a relative basis I am noticing some strengthening in the Morgan
Stanley US Investable Market Consumer Staples Index
(
MSCICS |
Quote |
Chart |
News |
PowerRating). As of this
week, the index has turned to positive on its’ relative strength point and
figure chart versus the S&P 500 Equal Weighted Index. The index is also
outperforming the Morgan Stanley US Investable Market Energy Index
(
MSCIEN |
Quote |
Chart |
News |
PowerRating)
on a short-term relative basis.
However, it has not improved to the point where I
am ready to place new money in the consumer staples sector. I am also looking at
the pharmaceutical sector and financial services sector, in particular Wall
Street firms, for places to add new money. Out of those, I would have to say
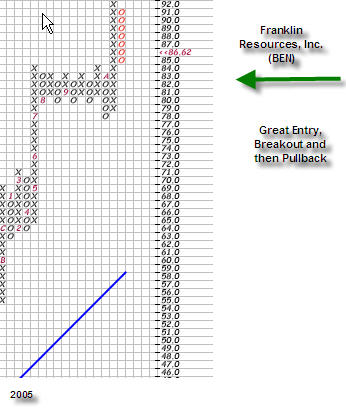
that Wall Street firms look the most promising. Franklin Resources, Inc.
(
BEN |
Quote |
Chart |
News |
PowerRating)
is a stock that looks quite attractive. New money could be committed here. The
stock broke a triple top at $85.00, ran to $92.00, and has now pulled back to
$85.00, offering a great entry point for new buys. I would use a stop of $77.00.

Even though some stocks, such as
(
BEN |
Quote |
Chart |
News |
PowerRating) could be bought here, I would not
recommend a portfolio that is 100% invested in stocks at this time. Each
investors’ cash allocation should depend upon his or her own tolerance for risk,
but I would say that for the average investor that has no allocation towards
bonds, the correct amount of cash would be about 30% at this time. This is due
to the uncertainty of the viability of the traditional November to January bull
market because of the tremendous selling pressure that we had in October.
The main breadth indicator that I use is the New
York Stock Exchange Bullish Percent. This indicator will change from rising to
falling and vice versa if 6% of the stocks on the New York Stock Exchange change
from either being on buy signals or being on sell signals. A buy signal is when
the current column of Xs is able to rise above a previous column of Xs (the
stock is able to go higher than it went in the past), and sell signal is when
the current column of Os falls blow a previous column of Os (the stock is going
lower than it went in the past). This breadth indicator reversed over to Os
(indicating lower prices were likely) on September 22nd. The indicator currently
is at the 52 level.
I mentioned this level as important in a previous
column as it has not broken to this level and has only gone as low as 54 on its’
last three trips down. A break to 52 should be significant and should indicate
that the market will go lower. However, I always keep my eyes open for change
and will react as condition dictate. So, if the New York Stock Exchange has 6%
of its’ stocks move to being on buy signals, then this indicator will reverse to
58. At that point, I will become quite bullish and likely recommend a position
of 100% invested for those who do not use fixed income as a part of their
investment plan.

Sara Conway is a
registered representative at a well-known national firm. Her duties
involve managing money for affluent individuals on a discretionary basis.
Currently, she manages about $150 million using various tools of technical
analysis. Mrs. Conway is pursuing her Chartered Market Technician (CMT)
designation and is in the final leg of that pursuit. She uses the Point and
Figure Method as the basis for most of her investment and trading decisions, and
invests based on mostly intermediate and long-term trends. Mrs. Conway
graduated magna cum laude from East Carolina University with a BSBA in finance.
