Big directional move coming, maybe today
Monday’s session was
opening bell gap & ramp, sideways prop by the big funds in artificial
fashion followed by last minute dumping of said stock futures right to 4:15pm
closing bell. Tuesday’s FOMC session was nothing more than sideways coil
followed by chop & flop into the finish. When we see two days of sideways
confusion back to back like this, we know that one or more big directional
sessions likely draweth nigh.
Be prepared for a big rally or sell-off trend
session ahead this week… possibly today.
Housekeeping: A number of TM readers from
this column emailed me asking about daily-chart readings after Monday’s final
minutes’ plunge. I do not have any answers as to why various chart services
do/don’t record data properly thru all historical market action. I do know that
intraday chart settings are always more accurate and precise than daily chart
settings. Why? You need to ask the chart software technicians those questions! I
plead ignorance & indifference to the cause.
Meanwhile, there are 405 minutes inside each cash
market trading session from 9:30am EST thru 4:15pm EST. In other words, 6.75
hours x 60 minutes = 405 cash market minutes. Simply set your chart service to
cash-session only symbol on a 405 minute chart and voila`… you have the most
accurate daily chart setting possible.
ES (+$50 per index point)

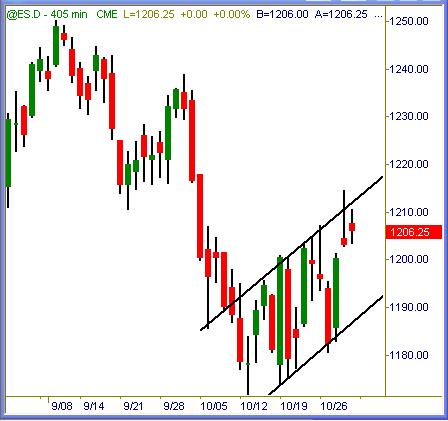
S&P 500 traded an inside session yesterday
following a gravestone doji bearish candle from Monday’s ramp & plunge. What
does this mean? Not much, other than price action breaking above the channel AND
Monday’s candle would be bullish. Failure to do that likewise sends price action
back down toward lower channel support where they’ll test the trendline support
again.
ER (+$100 per index point)

Russell 2000 also held an inside day, and hangs
“in space” waiting for the ultimate resolution to this sideways congestion here.
Biased bulls and bears alike are all scrambling to make their cases for why
price action is destined to go up or down from here. My view? The tapes are at a
crossroads of decision and could go either way with equal ease.
This Session:
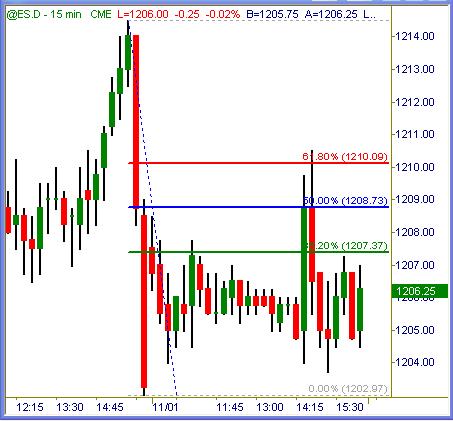
ES (+$50 per index point)

The post-Fed action on Tuesday saw price action
spike right to 62% of the previous swing resistance before settling back down
into its sideways coma. Yesterday highs will be key to direction today. Take
them out and it’s clear sailing above. Fail at that mark or lower and we could
see test of recent lows again real soon.
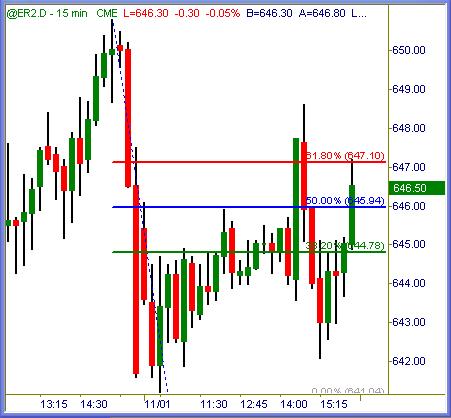
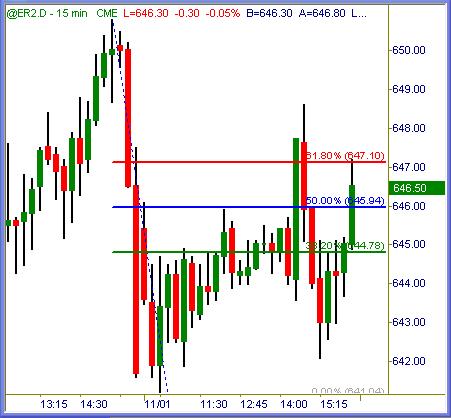
ER (+$100 per index point)

Russell 2000 stabbed thru resistance and tested
it again at the closing bell. Tuesday highs could once again be pivot marks
inside today’s hi-lo range action.
Summation
If I had to lean one direction by necessity, these patterns in the
daily charts are bear-flag continuation setups that should break lower to cover
(at least) equal chart distance from September highs to October lows. I know all
about the recent COT reports, bullish seasonal period, etc ad nauseum. All media
forums are filled with solid cases for markets to rally strong from now until
year’s end or beyond.
All good stuff but in the end, charts don’t care
what anyone says or believes. No one on earth knows what will happen next, it is
all educated guesswork at best. Eschewing any long-term bias and trading each
day for what we see is the mark of a successful intraday trader. Always remember
that!Â
Trade To Win
Austin P
(Weekend Outlook trend-view
section… open access)
