Here’s 2 ETFs poised for more gains
Stocks finished up last week on a
quiet note, as the major indices held on to
their impressive gains from the rally that began on October 28. The major
indices sold off modestly in the morning and traded sideways throughout the
afternoon, but buyers stepped in during the final thirty minutes and enabled the
broad market to close mostly flat. Both the S&P 500 and Dow Jones Industrials
(
DJX |
Quote |
Chart |
News |
PowerRating)
finished unchanged, while the Nasdaq Composite
(
COMP |
Quote |
Chart |
News |
PowerRating) advanced 0.4%. The
Russell 2000
(
RUT |
Quote |
Chart |
News |
PowerRating) and S&P 400 Midcap indices
(
MDY |
Quote |
Chart |
News |
PowerRating) each dropped less
than 0.1%.
Total volume in both the NYSE and Nasdaq declined by
approximately 25% last Friday, indicating traders and investors took a break
from the markets. Given that the major indices were mostly unchanged, it could
be considered a positive that volume declined as well. If volume had increased
on a day of flat market activity, it would have indicated bearish “churning”
activity that often precedes a reversal. But, so far, there have been no signs
of traders selling into the recent strength.
Not surprisingly, industry sector performance was rather mixed
last Friday as well. However, the Biotech Index
(
BTK |
Quote |
Chart |
News |
PowerRating) showed relative
strength and gained 0.8%. This caused
(
BBH |
Quote |
Chart |
News |
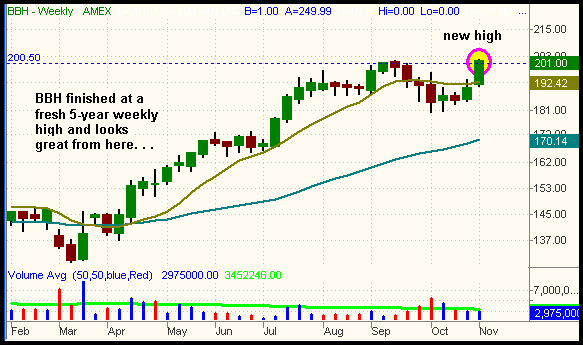
PowerRating), which we bought on November 3,
to rise another 2 points. As anticipated, it finished the week at a new 5-year
high closing price of $201. Due to a complete lack of overhead resistance, we
expect further gains in the coming week, so we will trail a stop to protect
profit and maximize the gain along the way:

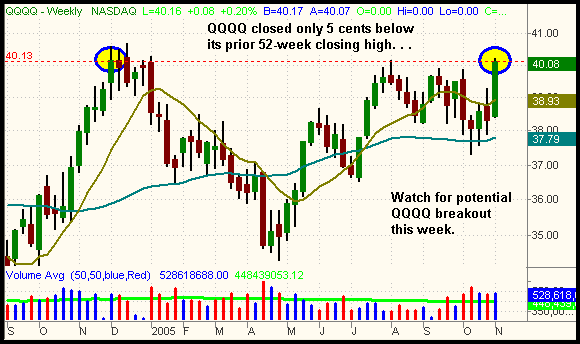
Another ETF that is looking good for a potential breakout is
(
QQQQ |
Quote |
Chart |
News |
PowerRating)
(Nasdaq 100 Index). After gapping up above its three-month downtrend line on
November 3, it followed up with another day of gains on November 4 and closed
right at a pivotal breakout level on its weekly chart. QQQQ has essentially been
consolidating since July and is only a few cents away from setting a new 52-week
closing high. The red horizontal line on the weekly chart below marks the prior
52-week closing high of $40.13, which QQQQ tested but closed below last Friday:

Because QQQQ is only a few cents from a new 52-week high, be
careful about the possibility of a false breakout. Institutions know that many
people have buy stops just over the $40 level here, so we would not be surprised
to see whippy action in an attempt to “run the stops.” However, high volume and
strong market internals would likely confirm whether a breakout is for real or
merely a probe above the highs. It may pay to wait for a confirmed close above
this resistance level, then wait to buy the first subsequent pullback. This
provides you with a lower risk entry point than buying the initial breakout
attempt.
Open ETF positions:
Long BBH (regular subscribers to
The Wagner Daily receive detailed stop and target prices on open
positions and detailed setup information on new ETF trade entry prices. Intraday
e-mail alerts are also sent as needed.)
Deron Wagner is the head trader of Morpheus Capital Hedge Fund and founder of
Morpheus Trading Group (morpheustrading.com),
which he launched in 2001. Wagner appears on his best-selling video, Sector
Trading Strategies (Marketplace Books, June 2002), and is co-author of both The
Long-Term Day Trader (Career Press, April 2000) and The After-Hours Trader
(McGraw Hill, August 2000). Past television appearances include CNBC, ABC, and
Yahoo! FinanceVision. He is also a frequent guest speaker at various trading and
financial conferences around the world. For a free trial to the full version of
The Wagner Daily or to learn about Deron’s other services, visit
morpheustrading.com or send an e-mail
to
deron@morpheustrading.com .
