This action confirms a bullish market
The major
indexes continued higher last week to finish at their best levels in nearly 3-months. Market pundits cited a decline in the price of crude oil and long rates
for the favorable action in the equities markets. The gains were even more
impressive in light of the fact that both Cisco Systems
(
CSCO |
Quote |
Chart |
News |
PowerRating) and Dell Computer
(
DELL |
Quote |
Chart |
News |
PowerRating) posted
lackluster earnings reports. The key indexes were also overbought according to
many oscillators coming into the week, so the fact that equities finished higher
was a testament to how bullish things currently are. Financial and Technology
shares were the upside leaders, which are the 2 groups you like to see paving
the way higher. Energy shares suffered another tough week, as they were unable
to overcome a drop in commodity prices.
The December SP 500 futures closed out the week with a gain of
+16.00 points, while the YM finished with a litte better relative gain of +176
points. On a weekly basis, both contracts extended last week’s gains and are
ready to test their September highs. Looking at the daily charts, both the ES
and YM hit their final targets on their Butterfly patterns. For you daily
3-Line Break followers, the ES remains long with a new Break Price of 1218.00,
while the YM remains long with a new Break Price of 10538.
The low volume seen in recent days may be indicating that the
normal slow holiday conditions are upon us. Historically, November and
December, while slow, are bullish months for equities and I don’t see any reason
why things should be different this year. Keep in mind, the markets have had to
contend with higher energy prices, rising interest rates, a Greenspan-induced
fear of a housing bubble, and a corporate scandal in Refco. Nonetheless, the
equities markets have held their own and have even managed to move higher in
recent weeks.
All of this
bad news recently has likely caused many institutional players to be on the
wrong side of the market, and may also account for the persistency of the
current advance. Much like in corporate America where upper management’s pay is
performance-driven, the so-called investment “professionals†are also paid on
performance. So, there is little room to miss a rally late in the year.
Because of this, I wouldn’t be surprised to see further pullbacks that are
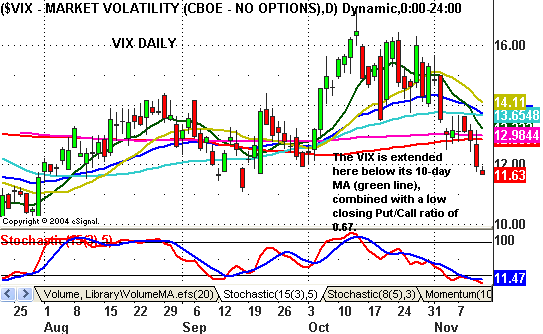
shallow in nature. The VIX has become extended to the downside, and
combined with the low Put/Call ratio, the week could start on a weak note.

Daily Pivot Points for 11-14-05
Â
| Symbol | Pivot | R1 | R2 | R3 | S1 | S2 | S3 |
| INDU | 10673.31 | 10709.18 | 10732.33 | 10768.20 | 10650.16 | 10614.29 | 10591.14 |
| SPX | 1233.71 | 1236.71 | 1238.69 | 1241.69 | 1231.73 | 1228.73 | 1226.75 |
| ES Z5 | 1236.42 | 1240.33 | 1242.67 | 1246.58 | 1234.08 | 1230.17 | 1227.83 |
| SP Z5 | 1236.57 | 1240.03 | 1242.07 | 1245.53 | 1234.53 | 1231.07 | 1229.03 |
| YM Z5 | 10694.33 | 10734.67 | 10759.33 | 10799.67 | 10669.67 | 10629.33 | 10604.67 |
| BKX | 103.37 | 103.86 | 104.13 | 104.62 | 103.10 | 102.61 | 102.34 |
| SOX | 463.28 | 466.19 | 471.23 | 474.14 | 458.24 | 455.33 | 450.29 |
Weekly Pivots for the Week of 11-4-05
Â
| Symbol | Pivot | R1 | R2 | R3 | S1 | S2 | S3 |
| INDU | 10633.96 | 10748.53 | 10811.02 | 10925.59 | 10571.47 | 10456.90 | 10394.41 |
| SPX | 1228.49 | 1241.93 | 1249.14 | 1262.58 | 1221.28 | 1207.84 | 1200.63 |
| ES Z5 | 1231.33 | 1245.42 | 1252.83 | 1266.92 | 1223.92 | 1209.83 | 1202.42 |
| SP Z5 | 1231.37 | 1245.23 | 1252.47 | 1266.33 | 1224.13 | 1210.27 | 1203.03 |
| YM Z5 | 10648.67 | 10780.33 | 10850.67 | 10982.33 | 10578.33 | 10446.67 | 10376.33 |
| BKX | 102.25 | 104.51 | 105.44 | 107.70 | 101.32 | 99.06 | 98.13 |
| SOX | 459.37 | 470.10 | 479.06 | 489.79 | 450.41 | 439.68 | 430.72 |
Please feel free to email me with any questions
you might have, and have a great trading week!
Chris Curran
Chris Curran started his trading career at the
age of 22 with a national brokerage firm. He combines fundamentals and
technicals to get the big picture on the market. Chris has been trading for 15
years, starting full time in 1997, and has never had a losing year as a
full-time trader.
