Is this another bubble? This indicator can tell you
While reviewing the market this past weekend, I couldn’t help but feel like
the good times were returning. Google hit $400 a share, leading the NASDAQ
100 to bull market highs. A cover headline in Business 2.0 announces
“Tech’s Big Comeback”, explaining “Why Startups Are Hot
Again.” I examined stocks with the highest dollar volume traded on
Friday and found that five high performing “e-Conomy” stocks were in the
top twenty. Of all issues traded on the NYSE and NASDAQ, Amazon
(
AMZN |
Quote |
Chart |
News |
PowerRating) was
#3, Google
(
GOOG |
Quote |
Chart |
News |
PowerRating) #4, Yahoo!
(
YHOO |
Quote |
Chart |
News |
PowerRating) #10, Apple
(
AAPL |
Quote |
Chart |
News |
PowerRating) #13, and
Qualcomm
(
QCOM |
Quote |
Chart |
News |
PowerRating)
#19. Indeed, excluding exchange-traded funds, AMZN and GOOG were the two
stocks with the highest dollar volume. With so much money going into a narrow group of stocks–and memories
of the tech stocks’ bear market so fresh–it makes sense to ask the question of
whether we’re seeing a bubble in the making or an uptrend with legs to spare.
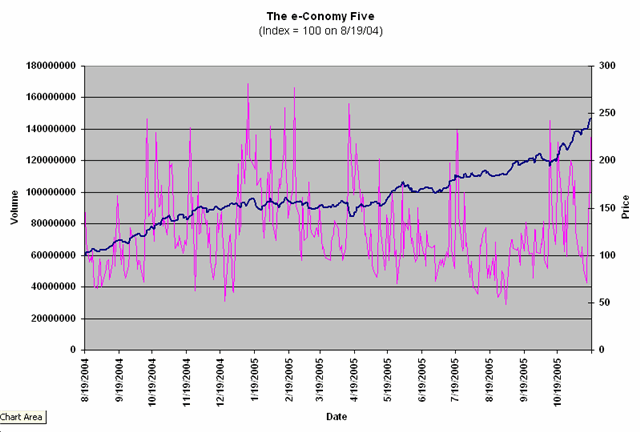
There’s no questioning that the e-Conomy stocks have been on a tear. I
went back to August, 2004–the debut of Google–and constructed an index of the
five e-Conomy issues. The index assumes equal dollar amounts invested in
AMZN, GOOG, YHOO, AAPL, and QCOM and tracks end-of-day prices. Volume is
simply computed as the sum of daily volumes for the five stocks. Below we
can track the uptrend in the e-Conomy Index (blue line) and the episodic surges
in volume (red line).

The e-Conomy Index has more than
doubled, rising from 100 to 244 since August, 2004. By comparison, the S&P 500
Index, as tracked by the SPY exchange-traded fund, has risen from approximately
110 to 125 in the same period, and the NASDAQ 100
(
QQQQ |
Quote |
Chart |
News |
PowerRating) has moved from 33.67 to 41.45. This
is outperformance of the highest order. Below we can see the contribution
of the individual issues to the e-Conomy Index performance. Interestingly,
it is AAPL, not GOOG, that is the performance leader, but clearly both are head
and shoulders above the others.
| Stock | Beginning Price (8/19/04) | Current Price (11/18/05) |
| Amazon (AMZN) | 38.63 | 47.98 |
| Google (GOOG) | 100.34 | 400.21 |
| Yahoo (YHOO) | 28.11 | 41.54 |
| Apple (AAPL) | 15.36 | 64.56 |
| Qualcomm (QCOM) | 35.51 | 45.93 |
While the e-Conomy stocks have been great for investors, they’ve been equally
kind to daytraders, who crave volatility. The average daily price change
of the e-Conomy Index since August, 2004 has been 1.18%, compared to .52% for
SPY and .70% for QQQQ. To put this into perspective, we’ve had no days in
SPY since August, 2004 where the price has moved 2% or more and only 8 days in
QQQQ (out of 316 trading sessions). The e-Conomy Index, however, has
registered 2% moves on 64 occasions–about once every week.
So is the news too good to be true? Is this March, 2000 or are we still
prepared to party like it’s 1999?
A glance at the the above chart of the e-Conomy Index price and volume
reveals something interesting. Total volume across the five stocks has not
expanded over the 2004-2005 period. One would expect, if this was a bubble
in the making, that an increasing speculative trade would be fueling the
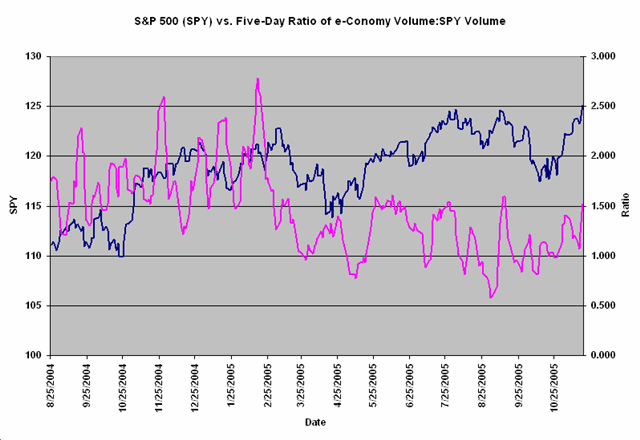
rises. So far this hasn’t been happening. Indeed, as we see below,
if we take five day average volume in the e-Conomy stocks vs. five-day volume in
SPY, the ratio (red line)–if anything–has been dropping. My analysis
shows that average price changes in the e-Conomy stocks for the first half of
the period covered by the chart have been larger than those for the second
half. Speculators have not been flocking to these issues, despite
their dramatic longer-term performance and their short-term trading
potential.

I am well aware that the mere act of writing about the e-Conomy
may be part of a larger bell-ringing at a market top. Nonetheless, my best
estimate is that bear market memories are too fresh to be fueling a true bubble
at this juncture. Ask the man on the street what the stock market is
doing, and he says it’s going nowhere. He isn’t breathless with hot tips
about the next Apple or Google, and he certainly is not leveraging his mortgage
to get into the e-Conomy stocks. In my articles and on my
free website, I’ll continue to track e-Conomy Index volume as a percent of
S&P 500 volume. Once that ratio elevates, let’s see how much of the e-Conomy
Index volume represents aggressive buyers taking offering prices vs. panicky
sellers hitting bids. That rang the bell to the upside in 1999 and the
downside in 2000, and I suspect it will do so again. Stay tuned!
Brett N. Steenbarger, Ph.D. is Associate Clinical
Professor of Psychiatry and Behavioral Sciences at SUNY Upstate Medical
University in Syracuse, NY and author of The
Psychology of Trading (Wiley, 2003). As Director of Trader Development
for Kingstree Trading, LLC in Chicago, he has mentored numerous professional
traders and coordinated a training program for traders. An active trader of the
stock indexes, Brett utilizes statistically-based pattern recognition for
intraday trading. Brett does not offer commercial services to traders, but
maintains an archive of articles and a trading blog at www.brettsteenbarger.com.
He is currently writing a book on the topics of trader development and the
enhancement of trader performance.
