The OEX needs to clear this level to get me bullish
Charles Sachs has utilized S&P 100 for the past 14 years, both as a trader and an advisor. He uses 24 proprietary indicators in order to structure options strategies which can generate gains whether the market moves up, down or sideways.
Financial markets traded higher Tuesday with the
(
XEO |
Quote |
Chart |
News |
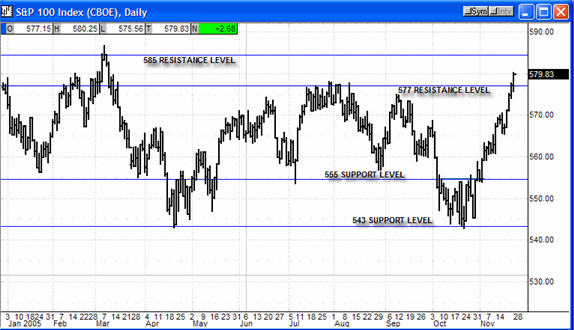
PowerRating) (S&P 100) index trading up 2.68 points to the 579.83 level.
The short-term market trend is up and overbought, and the intermediate-term market trend is up.
In looking at the chart below, we see that the S&P 100 index has traded in a narrow range for most of the year between the 555 and 577 levels. At its most extreme levels, the index traded as low as the 542 level and as high as the 587 level.
Going forward, the probabilities are that S&P 100 index will remain in its yearly trading range. Given that the S&P 100 index is now approaching the top of this range, caution is required.

Regarding investor sentiment, the chart of the
(
VIX |
Quote |
Chart |
News |
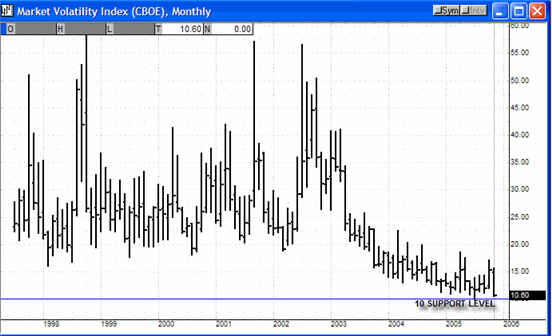
PowerRating) (Volatility) index below shows that complacency among investors is rampant. The VIX is currently trading at the 10.60 level, which is near a 10-year low.

The VIX volatility index has only hit single digits for very brief periods over the past 15-years (with a low of 9.04 in 1993). When the VIX declines into single digits, financial markets have been at or close to a market top.
Here is a brief explanation of the VIX.
The VIX index “measures market expectations of near term volatility conveyed by stock index prices.”
In other words, when investors are fearful, they tend to buy more options (primarily put index options) to protect their portfolios. The increase in demand for options raises the price of the options, and therefore raises the value of the VIX index.
When investors are complacent, they tend to buy less put options, which drives down the price of options through decreased demand among investors. As the price of options decline, so does the value of the VIX index decline.
It is important to recognize that financial markets rise in part from short covering buying. Thus when the VIX index declines sharply, as it has recently, investors are complacent and less likely to initiate short positions. With less short interest in financial markets, there is less fuel for short-covering rallies.
Bottom Line:
It is likely that financial markets will remain in the trading range set forth in the chart above. While it is possible for stocks to rise in price in the short-term, due to the strength of the current advance phase, it is important to recognize that there is long-term resistance on the S&P 100 index at the 577-585 levels.
Additionally, the VIX volatility index is currently at multi-year lows showing extreme investor complacency, which is also a warning sign of a market top, or at the very least sideways trading in financial markets.
Going forward, we would recommend taking profits on long positions between the 577-585 levels on the S&P 100 index, or undertaking short positions for the more aggressive trader.
Sincerely, Charles Sachs Chief Options Strategist
