These 3 sectors offer the best rewards
Stocks traded in an very tight and narrow range in Friday’s holiday-shortened session, but the major indices eked out yet another day of modest gains. The S&P 500 Index hovered in a non-volatile range of only three points throughout the entire three and a half hour session and closed 0.2% higher. The Nasdaq Composite, Russell 2000, and Dow Jones Industrials each gained 0.1%, while the S&P Midcap 400 Index advanced 0.2%. It was the seventh straight day of gains for the broad market, albeit in a low volume, shortened trading session.
The half day of trading obviously resulted in much lower volume levels in both exchanges. Total volume in the NYSE was 63% lighter, while volume in the Nasdaq was 60% lighter than the previous day’s level. As of 1:00 pm EST the previous day, volume was more than 35% higher than where it finished on Friday. As such, we could assume that volume still would have been much lower than the prior day’s level even if it was a full trading session. Last Wednesday’s pre-holiday session came in below 50-day average levels as well. Therefore, the gains of the past two days have been more the result of a complete lack of sellers as opposed to heavy institutional buying interest. When the institutions return to the scene next week, we will see if the gains in the latter half of last week will be retained or if stocks correct from their steady advance.
Most industry sectors closed within 1% of unchanged levels on
Friday, but the Gold Index
(
GOX |
Quote |
Chart |
News |
PowerRating) was the exception. The GOX continued to flex its muscles, as the index gapped up and finished with a 2.3% gain and at a fresh record high. Spot Gold also surged to a new 17-year high on Friday, pushing our long position in
(
GLD |
Quote |
Chart |
News |
PowerRating) (Gold Trust) further into the money. We sold half of the GLD position for a very nice profit last week, but continue to trail a stop higher on the remaining shares. It will be interesting to see how Spot Gold reacts in the coming week as it tests the $500 per ounce level.
Another sector to keep an eye on in the coming week is the Semiconductor Index
(
SOX |
Quote |
Chart |
News |
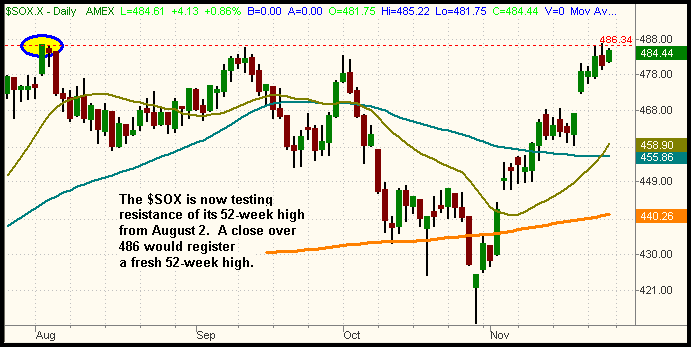
PowerRating), which closed last week just shy of its 52-week high. As you can see on the chart below, the SOX has made quite an impressive recovery since its October 28 low and is now only 0.3% away from breakout out above its 52-week high that was set on August 2:

Because the SOX has been rallying for the past month without much of a correction along the way, we would ideally like to see the index trade sideways for a couple of days before breaking out to a new high. A “correction by time” would reduce the odds of a failed breakout in the SOX. The best scenario would be a sideways to slightly descending trading range for 5 to 7 days, as such price action would form the handle of a bullish “cup and handle” chart pattern.
(
SMH |
Quote |
Chart |
News |
PowerRating) (Semiconductor HOLDR), which was formerly lagging behind the SOX itself, is now beginning to keep pace and may be setting up for a buy. We will be stalking SMH for potential long entry in the near future, although we would prefer to see consolidation in the SOX first.
In addition to SMH, a potential long entry in
(
BBH |
Quote |
Chart |
News |
PowerRating) (Biotech HOLDR) is also on our radar screen. We bought and sold BBH for a 7-point gain earlier in the month when it broke out to a new 4-year high, but have been waiting for at least a modest correction before re-entering it. BBH has begun a mild retracement over the past several days and should find support near its 20-day moving average in the coming week. If it does, we will be looking for a buy point after it subsequently breaks its hourly downtrend line.
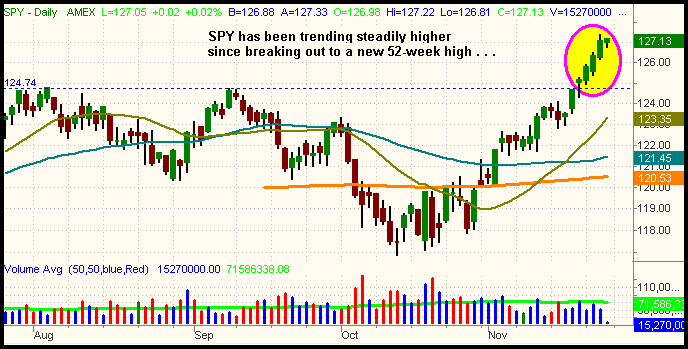
The fact that the broad market has closed higher for the past seven consecutive sessions is a great example of why we buy breakouts to new 52-week highs. A vast majority of the time, stocks and indices trading at new highs will continue trending higher for a long period of time. This occurs simply due to the lack of overhead resistance that is created when investors who formerly bought a stock at a higher price sell into a subsequent rally in an attempt to “just break even.” When a stock or index is trading at an all-time high, or at least a 52-week high, anybody who wanted to sell has already done so. This, in turn, greatly shifts the balance of power to the bulls. Correspondingly, it does not take a lot of buying pressure to keep a winning streak going in a stock or index that is at a new high. Looking at the daily chart of SPY (S&P 500 Index) below, notice how it trended steadily higher immediately after clearing its prior high (the blue horizontal line):
 
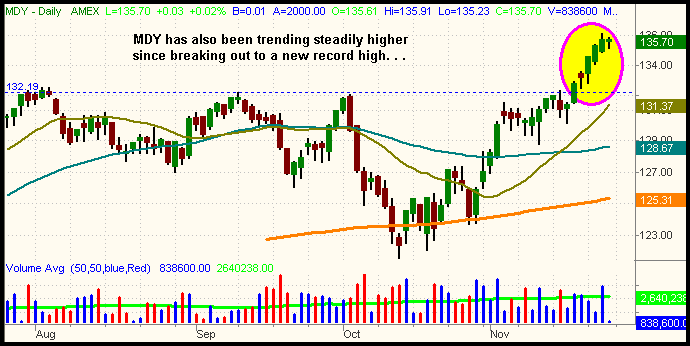
(
MDY |
Quote |
Chart |
News |
PowerRating), the ETF that tracks the S&P Midcap 400 Index, is another good example of how stocks at new highs typically continue trending much higher before correcting. MDY is sitting at a record high and therefore has no overhead supply from investors who were left “holding the bag” at a higher price:
 
Unfortunately, both human nature and most financial publications condition investors to buy low and sell high, rather than buying equities that are at new highs. The simple reality, however, is that buying high and selling higher is a much more profitable strategy. Thinking and reacting differently than the crowd is a definite prerequisite to becoming a consistently profitable trader.
Needless to say, overall odds favor the long side of the market in the intermediate-term. However, the risk/reward of aggressively establishing new long positions in the short-term time is not good. Although the indices are indeed trading at new highs, nothing goes up forever without correcting along the way. While it would be foolish and costly to attempt to predict a short-term top, the S&P, Dow, and Nasdaq have become quite extended away from support of their 20-day moving averages. Take a quick look at the historical charts and you will see that the major indices never remain overly extended from their 20-day moving averages for long. As we mentioned last week, you can think of the 20-MA as a leash that reigns in the price of a stock or index whenever it gets too far away from it in either direction. Therefore, a sideways “correction by time” or a price retracement (“correction by price”) is highly probable in the coming days. When the markets begin to correct, we’ll take a closer look at the key support levels where the indices should find support and provide for new long entry points.
Open ETF positions:
Long (half) GLD and long TLT (regular subscribers to The Wagner Daily receive detailed stop and target prices on open positions and detailed setup information on new ETF trade entry prices. Intraday e-mail alerts are also sent as needed.)
Deron Wagner is the head trader of Morpheus Capital Hedge Fund and founder of Morpheus Trading Group (morpheustrading.com), which he launched in 2001. Wagner appears on his best-selling video, Sector Trading Strategies (Marketplace Books, June 2002), and is co-author of both The Long-Term Day Trader (Career Press, April 2000) and The After-Hours Trader (McGraw Hill, August 2000). Past television appearances include CNBC, ABC, and Yahoo! FinanceVision. He is also a frequent guest speaker at various trading and financial conferences around the world. For a free trial to the full version of The Wagner Daily or to learn about Deron’s other services, visit morpheustrading.com or send an e-mail to deron@morpheustrading.com .
