Energy stocks demand focus daily
Kevin Haggerty is
the former head of trading for Fidelity Capital Markets. His column is
intended for more advanced traders. Kevin has trained thousands of traders
over the past decade. If you would like to be trained by him,
ext. 1.
The SPX finished the week -0.3%
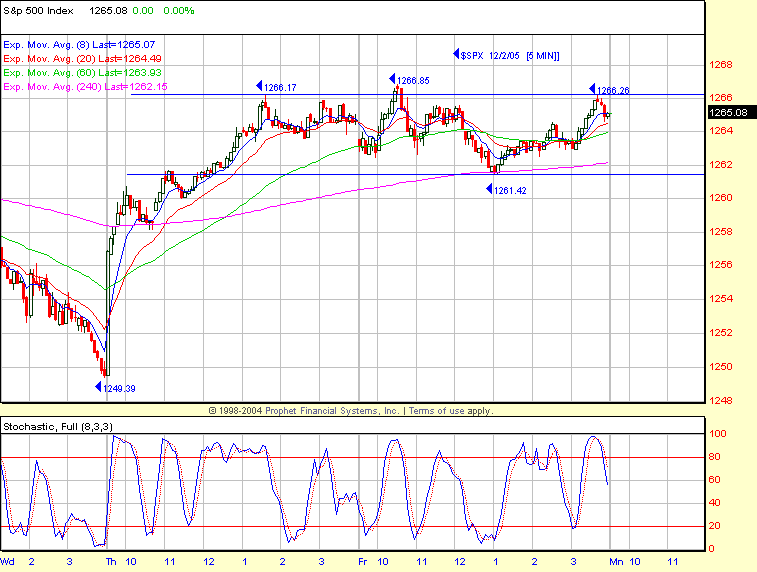
at 1265.08, with Friday flat and only a 5.4-point daily range. The Generals hit
the first day of December running, with new money, reallocation, etc, as the SPX
advanced +1.2% after hitting 1249.39 and 1249.48 lows on both Wednesday and
Thursday as minor support of the last rally high, 1245.86, was in play. The Dow,
10,878, was -0.5% for the week, while both the Nasdaq, 2273, and QQQQ. 41.54,
were both +0.5%. NYSE volume on Friday dropped to 1.52 billion shares with the
volume ratio neutral at 48 and breadth slightly positive at +223. The only two
sectors green on the week were the semiconductors, with the SMH +3.9% and OIH
+1.7%. All of the other sectors underperformed the -0.3% SPX, led by retail,
with the RTH -1.8%, financials, BKX, -1.3%, and XBD, -1.8%.Â
The Dow closed at 10,878 and is -3.0% from its rising wedge upper line at
11,200, which is also the 1.272 extension of the 10,985 – 10,219 leg down from
3/7/05 – 4/20/05. The Dow is +0.9% YTD while the SPX (the Generals’ bogie) is
+4.4% and the NDX, +5.4%. The same upper line for the SPX is about 1278, which
is also an extension of the last leg down from 1246 to 1168. 1273 is the 2.618
extension of the bull cycle Wave 1 leg from 769 – 954. Any early rally this week
into this symmetry coincides with the next time zone which comes into play from
12/7 – 12/15, so if there is to be any retracement before a final general
mark-up into year-end, it will occur in this time zone. The initial downside
levels for the SPX are 1235 – 1230 (-2.8%) and 1225 – 1220 (-3%) being the two
most likely zones with an outside shot to 1210 (-4.3%).
Daytraders keying on the SPX have the 2-day range between
1266-85 – 1261.42 and 1261.42 is also a 1,2,3 close (daily chart) setup, so that
is the initial downside focus on Monday. The leading sectors in this advance–XBD,
+21%, SMH, +20% and XLB, +17%–are obviously very extended short-term so there
is no percentage on aggressive intraday longside positions without some
meaningful retracement. Key energy focus list stocks like
(
DO |
Quote |
Chart |
News |
PowerRating),
(
RIG |
Quote |
Chart |
News |
PowerRating),
(
SUN |
Quote |
Chart |
News |
PowerRating),
(
UPL |
Quote |
Chart |
News |
PowerRating) and
(
SLB |
Quote |
Chart |
News |
PowerRating) have broken out to new highs as crude oil has declined,
so retracements to breakout levels should be watched.
(
HAL |
Quote |
Chart |
News |
PowerRating) and
(
KMG |
Quote |
Chart |
News |
PowerRating)Â
have some current continuation price room, while
(
NBR |
Quote |
Chart |
News |
PowerRating),
(
NE |
Quote |
Chart |
News |
PowerRating) and
(
RDC |
Quote |
Chart |
News |
PowerRating)
are at the high end of ranges. The absolute high average implied volatility of
the energy stocks demand daytraders’ focus daily regardless of how overbought or
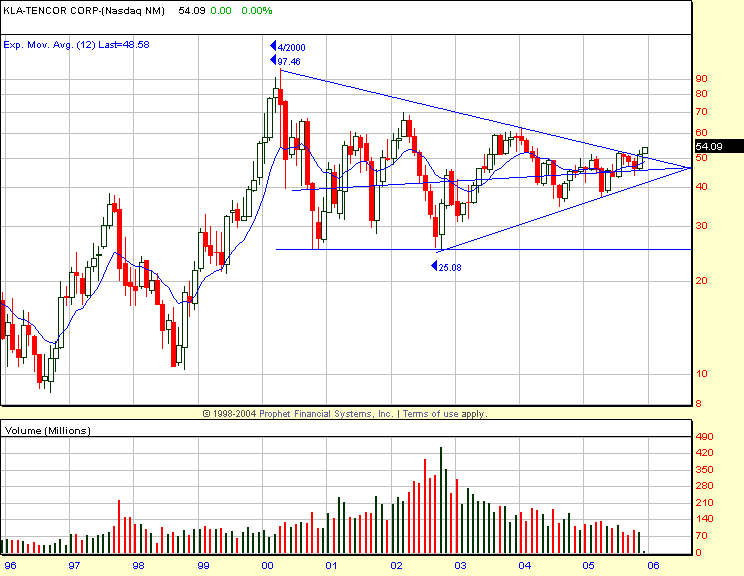
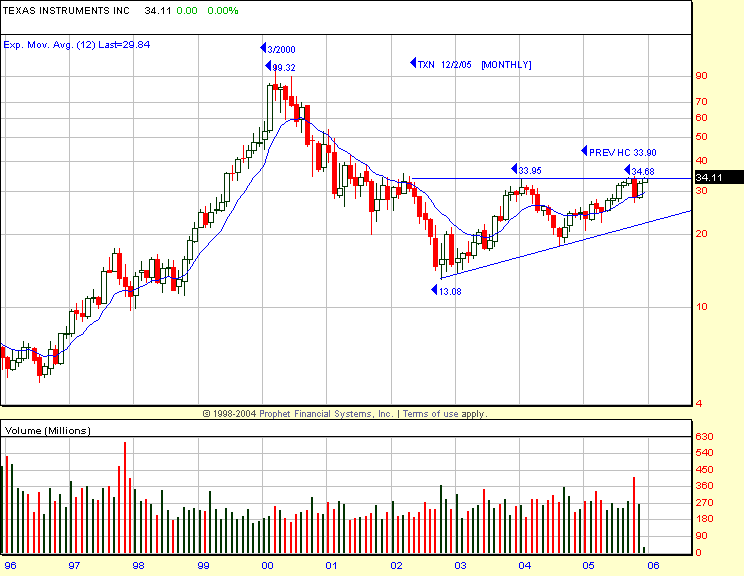
oversold they are. In the semis, any weakness in T
(
XN |
Quote |
Chart |
News |
PowerRating) and
(
KLAC |
Quote |
Chart |
News |
PowerRating)
certainly makes them price year-end mark-up candidates as they both have
interesting monthly patterns
Have a good trading day
Kevin Haggerty


