How far could the current rally go?
Oftentimes it is helpful to look at
longer-term charts in order to determine future levels of resistance and find
possible price objectives. Evaluating the long-term charts of the S&P
500, the NASDAQ Composite, and the Dow Jones Industrials may give us a clue as
to where this current rally could go.
If you use regular line charts, bar charts, or candlesticks,
you would just change your view from daily to weekly and then to monthly. In the
point and figure method, you just change the box size in order to see
information for a longer time period, and, in order to see where possible
resistance could be.
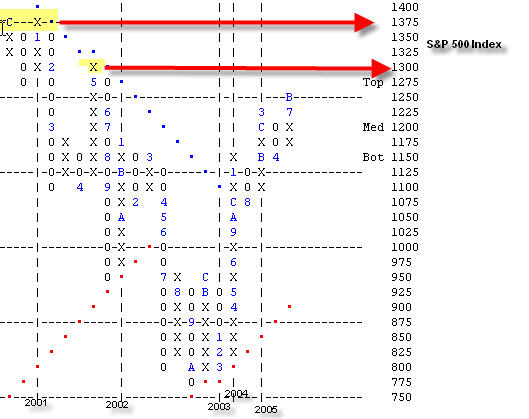
Below is the point and figure chart of the S&P 500 Index using
a 25-point box (still a three box reversal). Just this past month the S&P broke
through resistance at 1225 and now there is no other resistance until 1300. Even
that resistance does not seem too formidable, as it currently would just take a
double top breakout for the market to move through it.
The next level of resistance for the S&P is 1375 and that
could prove to be quite formidable as the market will have to break a triple top
(at least) in order to get through it. I say “currently†and “at least†because
the chart could have more movement back and forth before we approach the 1300
level that could cause the resistance at 1300 to seem more formidable and also
at 1375. Those levels are just the next two on which to keep your eyes peeled.

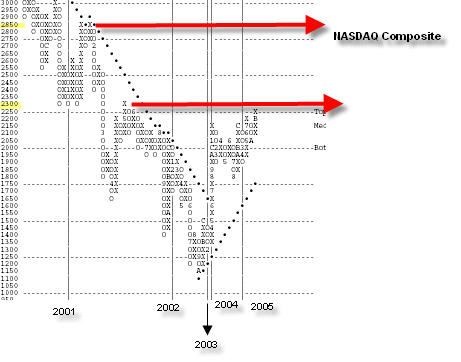
The next chart is the 50-point chart of the NASDAQ Composite. In order to see
the next two points of resistance with clarity, you should view this chart back
to 2000. The first level that could be a problem is 2300. There is one point of
resistance, but there is also some significant support that was formed at this
level in 2000 and 2001. Oftentimes former support will and does become future
resistance as it did one time before as evidence by the failure of the index to
go further in May of 2001. The next level that could serve as resistance is
2850. There is already some congestion formed there (a double top).

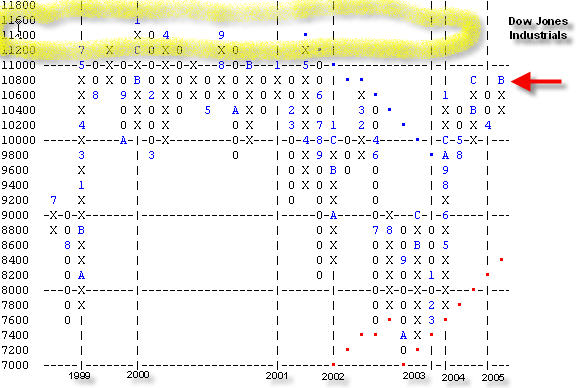
What follows is the 200-point chart of the Dow Jones
(
DJX |
Quote |
Chart |
News |
PowerRating). I could see the
next resistance the most easily on this chart. Currently, we are at resistance
at 10800. The Dow has been a laggard, and the market as a whole may need the
breakout to 11000 to continue the rally. I, personally, don’t think that that
needs to happen because of the Dow’s past inability to lead, and, because it is
not moving in concert with the Transports. This, of course, if you are a Dow
Theorist, could lead you to believe that the current rally is on a slippery
slope.
However, there is enough evidence in the bullish camp that
suggests that investors still need to participate here. As you can see looking
at the chart, there is a lot of overhead congestion beginning at 1120. The
congestion on this chart increases the validity of the hypothesis that investors
should be concentrating on mid to small cap stocks and that sector concentration
and rotation will continue to be the way to prosper. It also serves as evidence
to discourage investment in exchange traded funds that follow the Dow.

Â
Sara Conway is a
registered representative at a well-known national firm. Her duties
involve managing money for affluent individuals on a discretionary basis.
Currently, she manages about $150 million using various tools of technical
analysis. Mrs. Conway is pursuing her Chartered Market Technician (CMT)
designation and is in the final leg of that pursuit. She uses the Point and
Figure Method as the basis for most of her investment and trading decisions, and
invests based on mostly intermediate and long-term trends. Mrs. Conway
graduated magna cum laude from East Carolina University with a BSBA in finance.
