A thorn in the bull’s side?
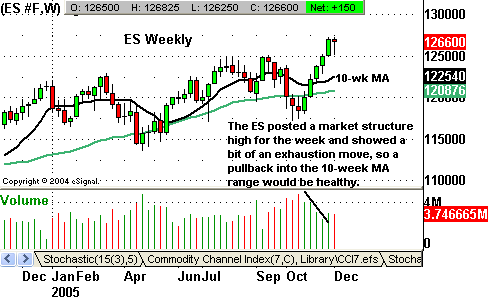
The major indexes finished mixed last week,
as some consolidation of the recent gains finally took place, with profit-taking
unfolding over the first 3 sessions.This came despite generally upbeat economic
data. Things changed on Thursday, however, when equities posted a sharp move
higher, with the bellwether Philadelphia Semiconductor Index
(
SOX |
Quote |
Chart |
News |
PowerRating) breaking
out in impressive fashion. The equities markets took a pause on Friday, but
once again Chip shares showed relative strength. Overall, it was healthy that
we saw sideways trading to work off the overbought condition. It’s also worth
noting that gold pushed through the key resistance level of $500, which was
another new multi-decade high.
Very little
has changed over the last few weeks with regard to the health of the current
advance. The rally has been supported by impressive market internals,
growth-orientated names and pretty robust inflows into mutual funds. Up until 4
weeks ago, inflows into mutual funds had been lackluster for the year, but that
has changed recently. The public is clearly getting involved with equity
investing again and this has provided some much needed fuel for the markets.Â
Should this trend of inflows continue, we could see a “snowball effect†rally in
the last 4 weeks of 2005.Â
Looking
ahead, though, there is no question that the Fed Meeting on December 13 could be
a thorn in the bull’s side. However, history has taught me that excess market
liquidity often trumps everything else when it comes to equities. This is
especially true in the month December, when year-end bonuses are on the line in
the investment business. With that said, unless something changes, I don’t see
any reason to try to be a hero and pick a top to this current rally.
                   
Â
Daily Pivot Points for 12-5-05
Â
| Symbol | Pivot | Â Â Â Â Â R1 | R2 | R3 | S1 | S2 | S3 |
| INDU | 10886.85 | 10912.03 | 10946.56 | 10971.74 | 10852.32 | 10827.14 | 10792.61 |
| SPX | 1264.45 | 1267.48 | 1269.88 | 1272.91 | 1262.05 | 1259.02 | 1256.62 |
| ES Z5 | 1265.58 | 1268.67 | 1271.33 | 1274.42 | 1262.92 | 1259.83 | 1257.17 |
| SP Z5 | 1265.60 | 1268.60 | 1271.20 | 1274.20 | 1263.00 | 1260.00 | 1257.40 |
| YM Z5 | 10902.00 | 10929.00 | 10969.00 | 10996.00 | 10862.00 | 10835.00 | 10795.00 |
| BKX | 104.38 | 104.74 | 105.01 | 105.37 | 104.11 | 103.75 | 103.48 |
| SOX | 505.16 | 508.77 | 511.94 | 515.55 | 501.99 | 498.38 | 495.21 |
Â
Â
Weekly Pivots for
the Week of 12-5-05
Â
| Symbol | Pivot | Â Â Â Â Â R1 | R2 | R3 | S1 | S2 | S3 |
| INDU | 10880.39 | 10956.91 | 11036.31 | 11112.83 | 10800.99 | 10724.47 | 10645.07 |
| SPX | 1260.96 | 1272.54 | 1279.99 | 1291.57 | 1253.51 | 1241.93 | 1234.48 |
| ES Z5 | 1263.17 | 1275.83 | 1285.67 | 1298.33 | 1253.33 | 1240.67 | 1230.83 |
| SP Z5 | 1262.57 | 1274.63 | 1283.27 | 1295.33 | 1253.93 | 1241.87 | 1233.23 |
| YM Z5 | 10898.33 | 10977.67 | 11066.33 | 11145.67 | 10809.67 | 10730.33 | 10641.67 |
| BKX | 104.74 | 105.93 | 107.38 | 108.57 | 103.29 | 102.10 | 100.65 |
| SOX | 496.48 | 517.45 | 529.31 | 550.28 | 484.62 | 463.65 | 451.79 |
Â
Please feel free to email me with any questions
you might have, and have a great trading week!
Chris Curran
Chris Curran started his trading career at the
age of 22 with a national brokerage firm. He combines fundamentals and
technicals to get the big picture on the market. Chris has been trading for 15
years, starting full time in 1997, and has never had a losing year as a
full-time trader.
