Here’s what’s next for the Dollar Index
FX:
We mentioned recently how USD/CHF was in
breakaway mode after rising above key channel resistance at 1.3030/00. Our long
USD/JPY from Sunday night at 1.16 is also up 130 pips.
Our trading position from last week was long USD/CHF
from 1.2810. A good technical objective for today is 1.3180. This is the upper
channel resistance from the rally from 1.28 as well as the 78.6% (square of
0.618) retracement of the 1.329 to 1.279 decline. As such, we closed this
trading position at 1.3160.
We remain long our core long position from
September with an averaged rate of 1.2930. We expect a move to 1.40/45 over the
coming months.
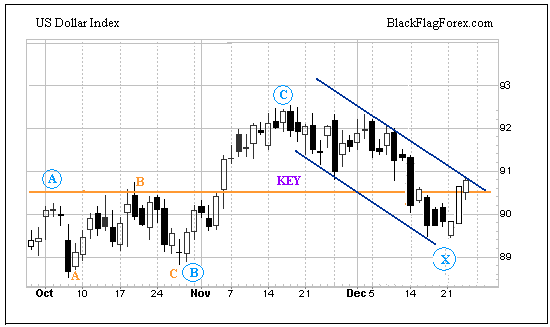
In the dollar index, we said, “A move above 90.50
this week will be needed to put things back on track for the dollar. As you can
see, while 90.50 failed to hold (and negated the good looking inverse head and
shoulders pattern), key channel support at 89.50 acted held up. Only a move
below 89.50 would negate the near term bullish stance and only a move below 87
would force us to revise our outlook for 2006.”
While we got the move back above the 90.50 level
today, the EUR/USD selloff still remains relatively subdued. EUR/USD needs to
break below channel support today at 1.1850 to give the dollar index a similar
break through channel resistance at 91.80 (blue line). So far, we are sitting
right on these levels this morning and the moves in USD/CHF and USD/JPY this
morning suggest it will be broken today and sitting to the outside of channel
resistance and above the 90.50 support by the close.

Stocks:
No change: The S&P’s sharp drop on Monday puts
into question the idea of an expected “wave v of 5” rally in the Dow to put a
cap on the ending triangle pattern that has taken two years to develop.
As such, we are now considering that the S&P500
has completed the targeted move to 1270 (recall that this became our target back
in November when it was clear that the 1160 level was not going to break). Key
Fibonacci resistance turned support is at 1245. So a move below here in “five
wave” form from the 1273 highs would go a long way to confirming that a top was
at hand.
Readers should recall that just about every
“contrarian” indicator we follow is screaming for a top in stocks. The only
concern we have is whethere globally the market is done. This was the main
reason that US equities caught a second wind this year.
We have not gone short the market yet, but feel
that aggressive traders may look to do so with risk limited to just above this
week’s highs. A bearish weekly reversal on Friday would be the first indication
of more weakness to come.
Bonds:
No change: Last Tuesday we wrote, “Yields look to
be trying to turn higher today and this would be consistent with our work that
shows yields had bottomed last month just as the 30-month cycle in Treasury
yields bottomed which means we should expect higher yields over the coming
months if this holds any sway. Key support is at 4.4%. Only a sustained move
below 4.4% would suggest a larger retracement at hand.”
Regards,
Jes Black
FX Money Trends
613 4th St Suite 505
Hoboken, NJ 07030
Tel: 646.229.5401
Jes
Black is the fund manager at Black Flag Capital Partners and Chairman of
the firm’s Investment Committee, which oversees research, investment and
trading strategies. You can find out more about Jes at
BlackFlagForex.com.
Prior
to organizing the hedge fund he was hired by MG Financial Group to help
run their flagship news and analysis department,
Forexnews.com. After four
years as a senior currency strategist he went on to found
FxMoneyTrends.com – a research firm catering to professional traders.
Jes
Black’s opinions are often featured in the Wall Street Journal, Barrons,
Financial Times and Reuters. He has also written numerous strategy pieces
for Futures magazine and regularly attends industry conferences to speak
about the currency markets.
