Stock traders, heed this alert from bonds
Last week we commented on the significant decline in global bonds and how
investors should be cautious of its impact upon US and global stock markets.
That indeed has been the critical theme of this week, as bond price pressures
have continued to exert pressure upon global equity markets and wreak some
havoc. When the character of the market environment shifts this considerably, it
is often advisable for investors to step back from the fray, cut positions to a
minimum and attempt to READ what the new message of the market is saying – and
what levels to watch in order to get a plurality of signals about that new
message. And that is what we would advise investors to do in this current
environment – lighten up considerably and READ the action.
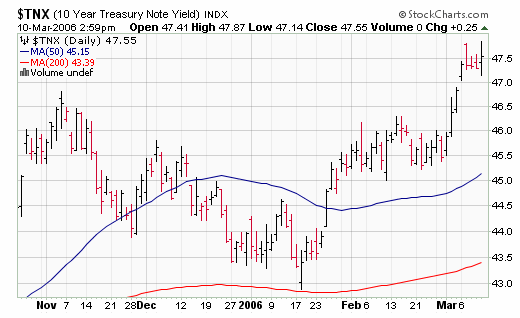
One of the most important charts is the monthly chart of 10-year yields. A
downtrend channel has been in force here since 1987, but that downtrend is being
tested. A break over 4.90 in 10-year yields breaks out over last year’s highs,
and the monthly downtrend line hits around the 5% level. Expect downside
fireworks to develop upon a move over 4.90 and increasingly on move over 5% in
10 year yields should this develop – that would certainly be a BATTEN DOWN THE
HATCHES signal if it develops.
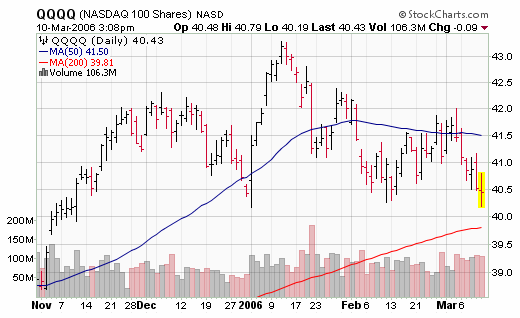
Investors should also watch the QQQQ’s for a high volume weak close below 40 and
below the 200-day moving average. Such an occurrence would likely add a fearful
and negative tone to a market that is already on the defensive.
(
VPL |
Quote |
Chart |
News |
PowerRating) below
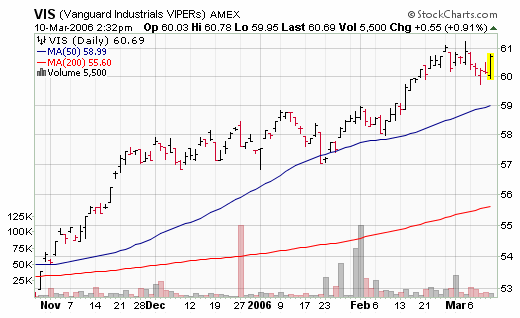
59 on a high volume weak close would also signal that Asia, a leader in the
advance, is weakening in RS and technically.
The dollar remains mired in a trading range between EUR 1.235 and 1.1640 – a
breakout of this range will likely lead to significant reaction in global
markets as well.
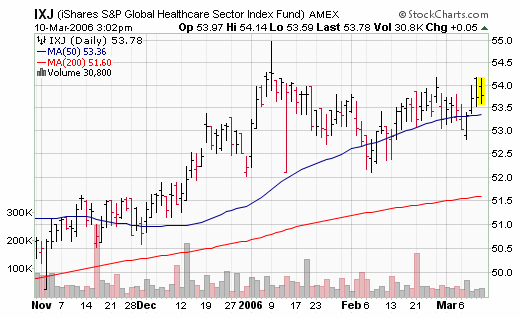
It is important to note what is holding up well. That is also fundamentally or
cyclically fueled at this time. So far the better sectors appear to be
industrials (where capital spending is likely to hold up far better than other
consumption), as well as traditionally defensive sectors such as health care
(our favorite of the defensives), telecoms, and staples. We’ll become more
friendly to staples on a combination of
(
XLP |
Quote |
Chart |
News |
PowerRating) breaking out over 24 and
(
IYK |
Quote |
Chart |
News |
PowerRating)
over 55. Singapore is holding up quite well among global bourses.
On the weak side are housing and Utilities (both interest rate sensitive), as
well as big cap internets and General Merchandise. Value seems to be breaking
out versus growth among all capitalizations, particularly large-caps, which is
in tune with late-cycle activity. Aggressive traders could position with strong groups over weak ones, but with
more cautious allocation than normal.
However anything other than minor positioning by anything other than the most
aggressive traders should probably be dictated on market action with plurality
developing from here. Bond breakdowns (bond yield breakouts) should send up a
huge caution sign and aim aggressive traders toward the bear side for trading
opportunities. Watch
(
QQQQ |
Quote |
Chart |
News |
PowerRating) and dollar for signals as well. Watching and
waiting is what hunters must become skilled at, and sometimes market hunters as
well.
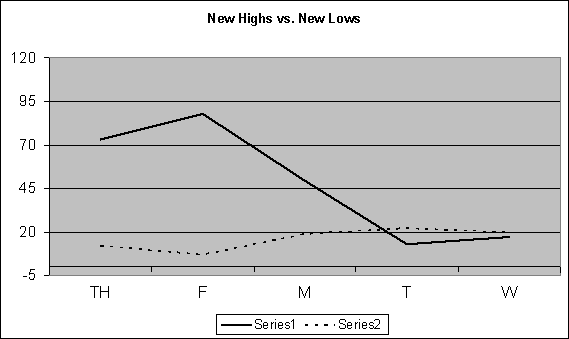
Over the past week in our Top RS/EPS New Highs list published on
TradingMarkets.com, we had readings of 73, 88, 49, 13 and 17 with 10 breakouts
of 4+ week ranges, MTU & TS as valid trades and no close calls. This week, our
bottom RS/EPS New Lows recorded readings of 12, 7, 17, 22 and 20 with 5
breakdowns of 4+ week ranges, no valid trades and no close calls. It is NOT
insignificant that the Top RS/EPS new highs fell below the bottom RS/EPS new
lows this week! The “model†portfolio of trades meeting criteria is now long
TRAD (stop close at hand if not stopped out already), GG (stop close at hand if
not stopped out already), RY (holding up well but tighten stop), RVSN (test of
50-day MA critical), AXA (this week’s lows and 50-day MA better hold), TS
(holding up well but tighten stop), and MTU (last month’s lows must hold).
Continue to tighten up trailing stops whenever possible on stocks with open
profits and strive to move stops to break-even or better as quickly as possible
in new entrants.
Mark Boucher has been ranked #1 by Nelson’s World’s Best
Money Managers for his 5-year compounded annual rate of return of 26.6%.
Mark began trading at age 16. His trading helped finance his education at the
University of California at Berkeley, where he graduated with honors in
Economics. Upon graduation, he founded Investment Research Associates to finance
research on stock, bond, and currency trading systems. Boucher joined forces
with Fortunet, Inc. in 1986, where he developed models for hedging and trading
bonds, currencies, futures, and stocks. In 1989, the results of this research
were published in the Fortunet Trading Course. While with Fortunet, Boucher also
applied this research to designing institutional products, such as a hedging
model on over $1 billion of debt exposure for the treasurer of Mead, a Fortune
500 company.
For those not familiar
with our long/short strategies, we suggest you review my book
The Hedge Fund Edge, my course “The
Science of Trading,”
my video seminar, where I discuss many
new techniques, and my latest educational product, the
interactive training module. Basically,
we have rigorous criteria for potential long stocks that we call “up-fuel,” as
well as rigorous criteria for potential short stocks that we call “down-fuel.”
Each day we review the list of new highs on our “Top RS and EPS New High List”
published on TradingMarkets.com for breakouts of four-week or longer flags, or
of valid cup-and-handles of more than four weeks. Buy trades are taken only on
valid breakouts of stocks that also meet our up-fuel criteria. Shorts are
similarly taken only in stocks meeting our down-fuel criteria that have valid
breakdowns of four-plus-week flags or cup and handles on the downside. In the
U.S. market, continue to only buy or short stocks in leading or lagging
industries according to our group and sub-group new high and low lists. We
continue to buy new long signals and sell short new short signals until our
portfolio is 100% long and 100% short (less aggressive investors stop at 50%
long and 50% short). In early March of 2000, we took half-profits on nearly all
positions and lightened up considerably as a sea of change in the
new-economy/old-economy theme appeared to be upon us. We’ve been effectively
defensive ever since, and did not get to a fully allocated long exposure even
during the 2003 rally.
