This sector is showing a lot of strength
The broad market traded in a
relatively dull, sideways range throughout
Wednesday’s session, but the major indices nevertheless built on their previous
day’s strong gains. The S&P 500 gained 0.4%, the Dow Jones Industrials
(
DJX |
Quote |
Chart |
News |
PowerRating)
0.3%, and the Nasdaq Composite
(
COMP |
Quote |
Chart |
News |
PowerRating) 0.9%. Small and mid-cap stocks also
kept pace, as the Russell 2000
(
RUT |
Quote |
Chart |
News |
PowerRating) advanced 0.8% and the S&P 400 moved
0.7% higher. Although the trading range was narrow, each of the major indices
finished near their intraday highs, a positive sign of institutional support.
Our short position in IWM stopped out for a small loss yesterday, but the long
position in PPH continued to build on its gains.
Total volume in the NYSE declined by 5% yesterday, while
volume in the Nasdaq was 4% lighter than the previous day’s level. It was
bullish that stocks built on their previous day’s gains, but it would have been
better if volume had risen as well. Still, volume in both exchanges remained
above 50-day average levels. Market internals were decent, as advancing volume
outpaced declining volume by nearly 5 to 2 in the NYSE. In the Nasdaq, the ratio
was positive by more than 3 to 1.
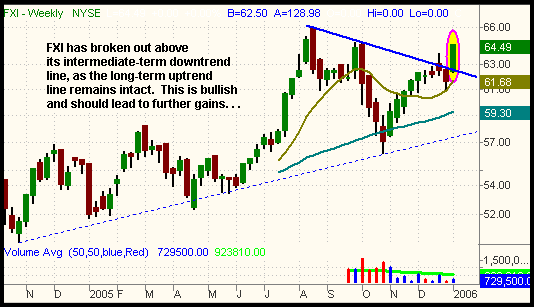
One sector that has suddenly begun to show a lot of strength
are the Chinese stocks. Both tech and industrial-related Chinese stocks began to
blast out of bases two days ago. This resulted in a corresponding breakout in
FXI, the ETF that mirrors the Xinhua 25 (mainland China’s equivalent of the Dow
Jones Industrials). FXI has been in a steady long-term uptrend since it was
launched in 2004, but it had been in an intermediate-term downtrend for the past
five months. However, the strength of the past two days enabled FXI to break out
above its intermediate-term downtrend line. Because the weekly uptrend remains
intact, we now expect a test of and possible breakout to a new all-time high in
the coming weeks. The break of the intermediate-term downtrend line is
illustrated on the weekly chart below:

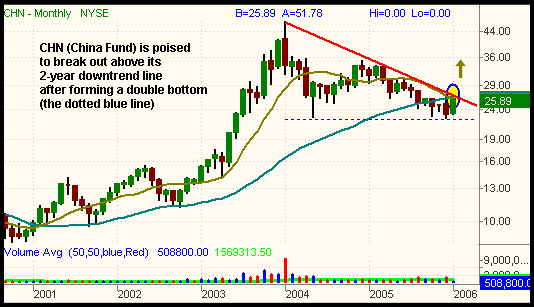
FXI is the only ETF that tracks the mainland Chinese markets
because iShares EWH is correlated to the Hong Kong market. CHN (China Fund) is
technically not an ETF, but is a closed-end management investment company that
trades like an ETF. CHN traded 400% greater than its average daily volume
yesterday and has rallied more than 11% over the past two days. It is now poised
to break out above a two-year downtrend line, as illustrated on the long-term
monthly chart below:

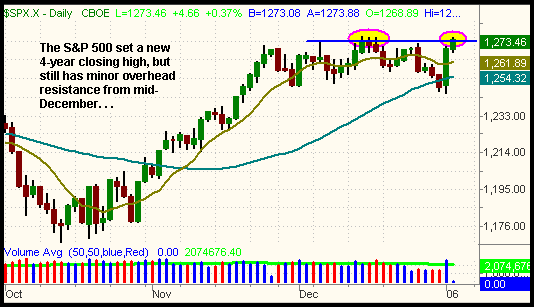
Of the five major indices we track on a daily basis, two of
them, the S&P 500 and mid-cap S&P 400, set new multi-year closing highs
yesterday. The broad-based S&P 500 closed at 1,273, less than one point higher
than its prior closing high from December 14, but still enough to qualify as a
new four-year closing high. The blue horizontal line on the chart below marks
the prior closing high from December 14:

Although the S&P 500 set a new closing high, notice there is
still minor overhead supply from the intraday highs of December 14 – 16. On
those days, the index traded up to nearly 1,276. Regardless, odds are good the
S&P 500 will at least probe above that level in the coming days. If it manages
to close firmly above 1,276, we could see a very strong rally ensue due to the
complete lack of overhead resistance. Such a breakout would also put the index
above its 61.8% Fibonacci retracement level that we discussed in the January 3
issue of The Wagner Daily.
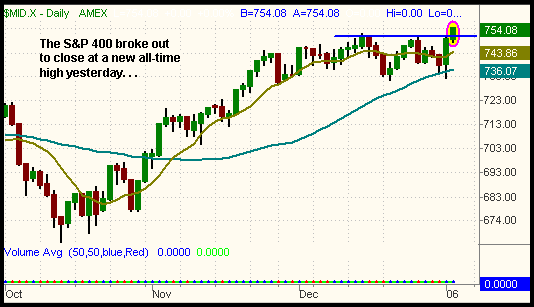
Even more impressive is the recent performance of the mid-cap
S&P 400 Index, which broke out of a narrow, seven-week base of consolidation and
closed at an all-time high. It also closed above all intraday highs from
December, indicating a clear break out to a new high:

Traders wishing to take advantage of the breakout in the S&P
400 may consider trading MDY, the primary ETF that mirrors the S&P 400 Mid-Cap
Index. SPY is obviously the ETF that tracks the S&P 500 Index.
As for the other indices, the Nasdaq Composite did not yet
rally above its December high, but is only ten points (0.4%) away. The small-cap
Russell 2000 Index is even closer to its prior high. It only needs to close two
points higher than yesterday in order to set an all-time closing high like the
S&P 400. The Dow Jones, as usual, continues to lag behind the most.
Open ETF positions:
Long PPH (regular subscribers to
The Wagner Daily receive detailed stop and target prices on open
positions and detailed setup information on new ETF trade entry prices. Intraday
e-mail alerts are also sent as needed.)
Deron Wagner is the head trader of Morpheus Capital
Hedge Fund and founder of Morpheus Trading Group (morpheustrading.com),
which he launched in 2001. Wagner appears on his best-selling video, Sector
Trading Strategies (Marketplace Books, June 2002), and is co-author of both The
Long-Term Day Trader (Career Press, April 2000) and The After-Hours Trader
(McGraw Hill, August 2000). Past television appearances include CNBC, ABC, and
Yahoo! FinanceVision. He is also a frequent guest speaker at various trading and
financial conferences around the world. For a free trial to the full version of
The Wagner Daily or to learn about Deron’s other services, visit
morpheustrading.com or send an e-mail
to deron@morpheustrading.com .
