Why the Next Leg for EUR and GBP May Be Down
After last week’s series of mixed signals, the EUR/USD and GBP/USD produced back to back medium and strong sell signals as the pairs broke out of their one week consolidation and finally made a clearer move to the downside.
Both of them on the Intraday and Daily charts have either already completed their weak crossovers of the Tenkan and Kijun lines to the upside, suggesting the next crossover signal will be medium/strong to the downside. Furthermore, cloud or ‘kumo’ constructions suggest the line of least resistance for both of them is to the downside.
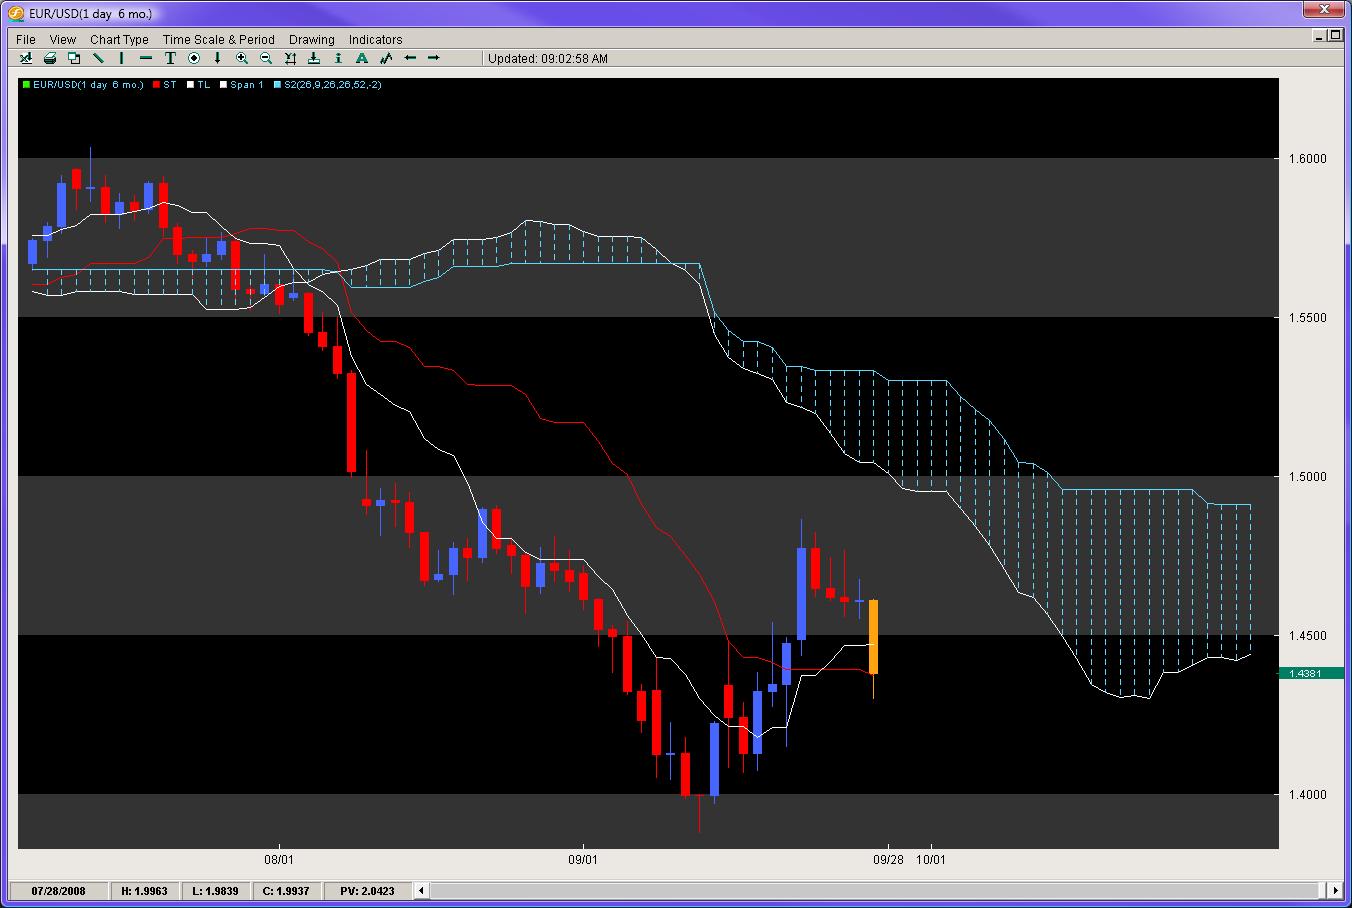
Taking a look at the EUR/USD on the daily chart, we see the pair, two weeks ago, finally had a break of the Kijun line (Red) which is a 26-period EMA. This was followed with a weak crossover of the Tenkan (white) and Kijun lines suggesting the two month sell off in the EUR/USD that summer was taking a brief rest.
Figure 1: EUR/USD Daily Chart

However, notice how thick the ‘Kumo’ or cloud is. The Kumo in Ichimoku models is designed to represent support/resistance levels very much like Fibonacci retracements. Thus, as a leading indicator, it can often tell us when a likely reversal is about to happen or not, based on the thickness of the cloud. The thicker the cloud, the less likely because there would be more resistance to chew through. Based on its current construction, the longer this pair waits to attack the upside, the less likely it will, since the cloud gets thicker heading into November.
Also, if the pair was to sell off, then we would likely see a trigger of the Tenkan and Kijun lines to the downside and below the cloud. This would signify a very strong sell signal according to Ichimoku models and would likely suggest 1.40 would be under attack either this week or next, and a break to the downside could produce an assault on the 1.35 handle.
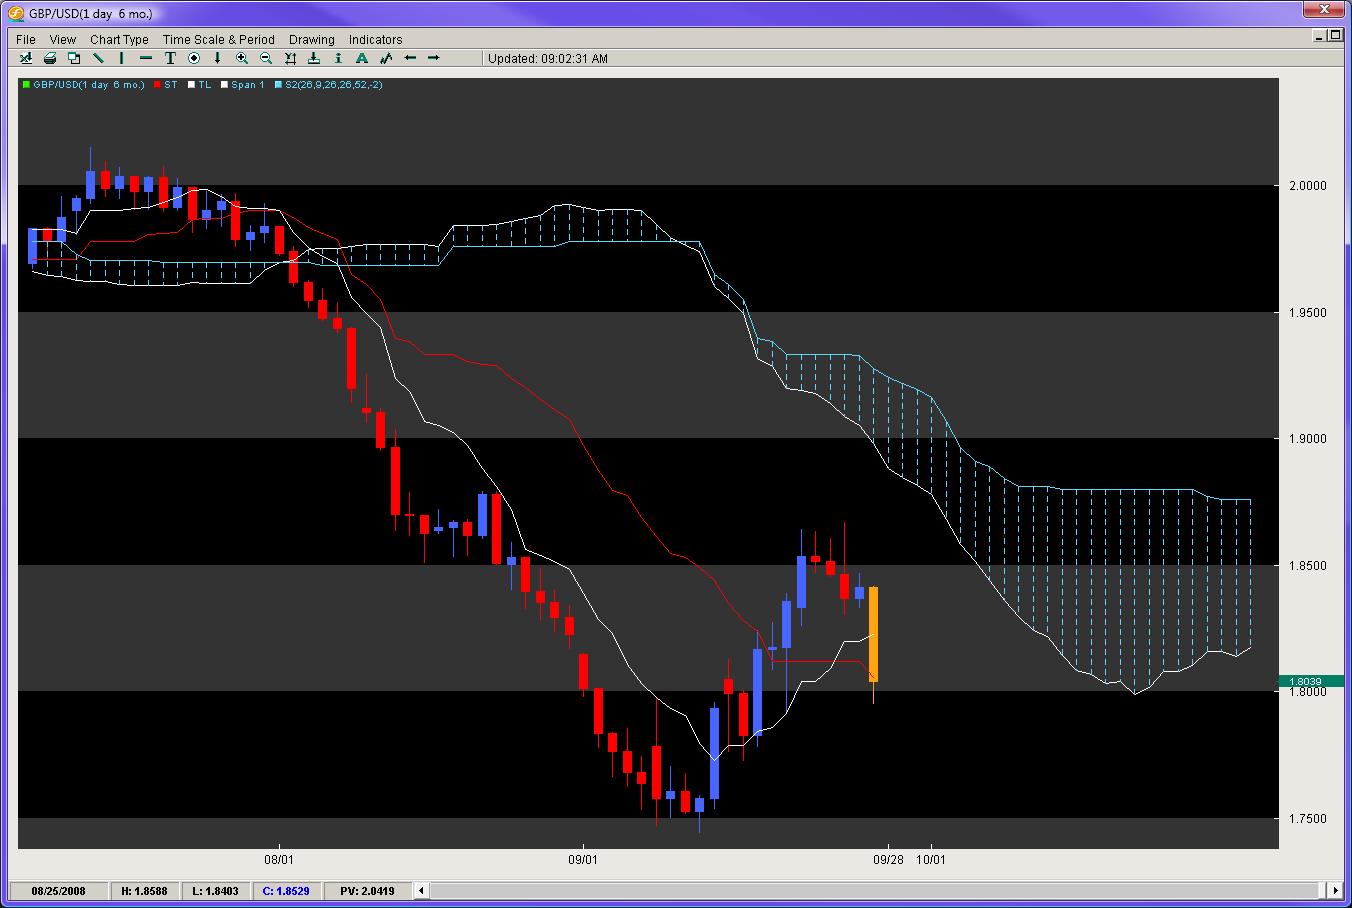
Moving on to the GBP/USD, we are seeing almost the identical chart formation with this pair also threatening to close below the Kijun line today. Although Momentum and MACD Histogram models are not totally behind it, after this week resistance for the GBP/USD increases in density, also suggesting the next likely significant swing push is to the downside.
Figure 2: GBP/USD Daily Chart

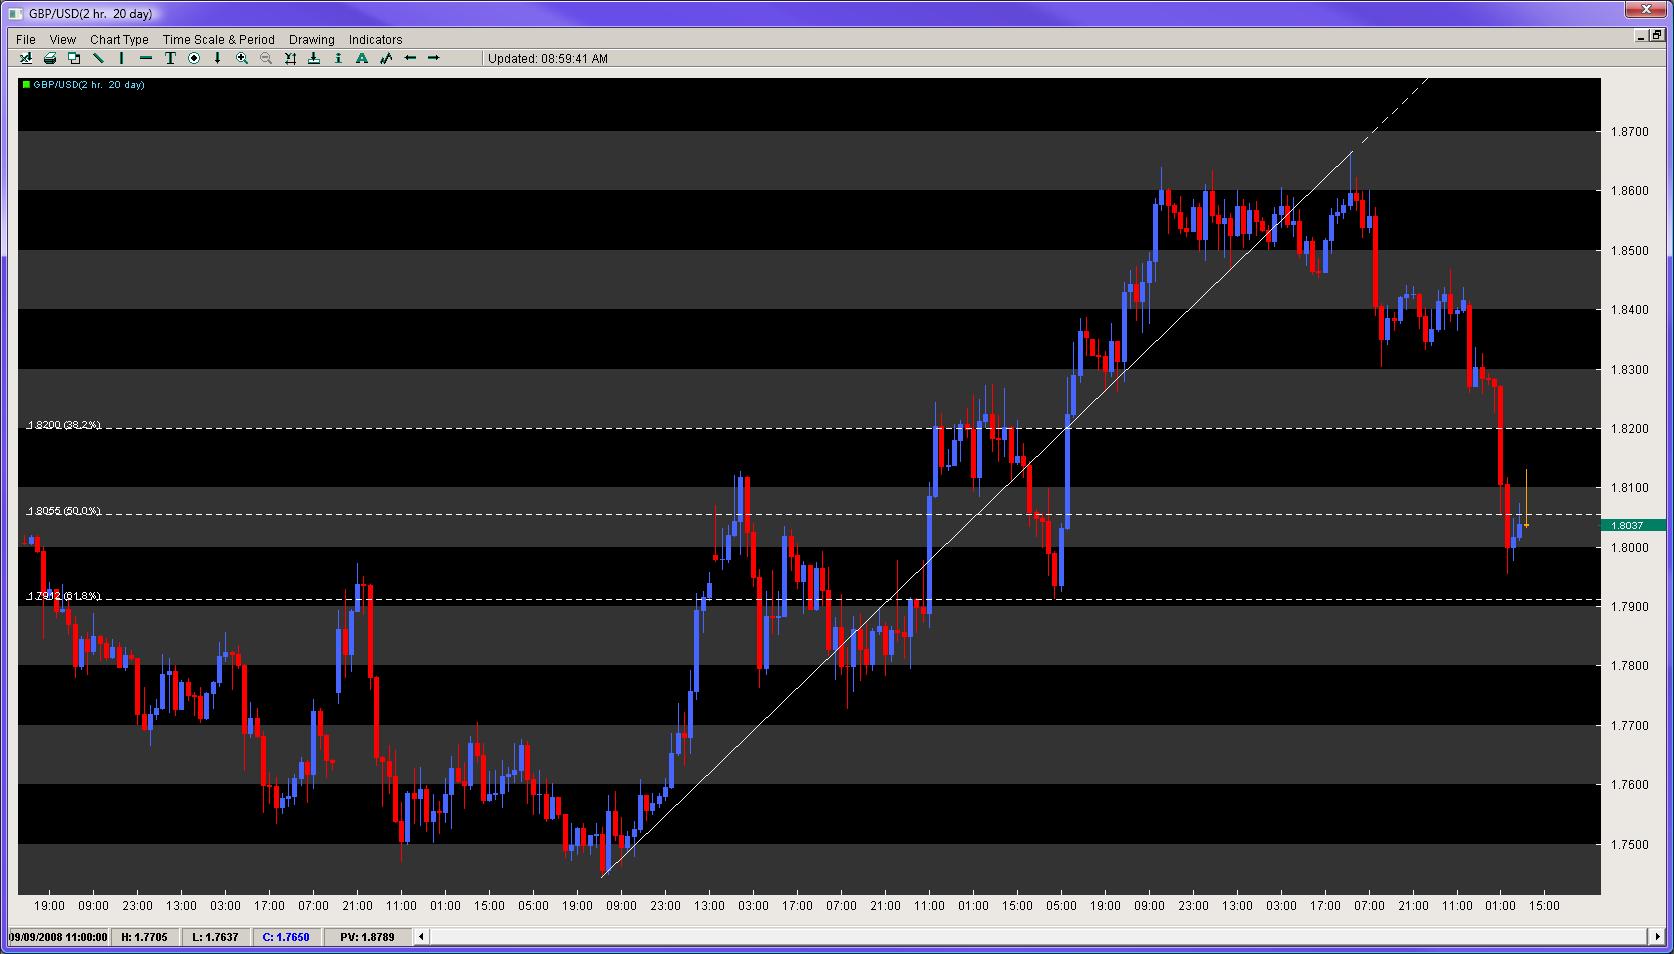
If the pair was to spend this week declining to at least the 1.78 handle, we could trigger a new strong Ichimoku sell signal which would mean 1.75 would be under threat and a potential move to the next big figure at 1.70. Also to note on the intraday charts is the bounce from 1.75 in mid September to the recent swing high at 1.8675 has a 61.8% fib retracement at approx. 1.7900. A close below 1.79 and 1.78 suggest 1.75 becomes a high probability target to the downside.
Figure 3: GBP/USD Intraday Chart

Chris Capre is the Founder of Second Skies LLC which specializes in Trading Systems, Private Mentoring and Advisory services. He has worked for one of the largest retail brokers in the FX market (FXCM) and is now the Fund Manager for White Knight Investments (https://WhiteKnightFXI.com). For more information about his services or his company, visit https://2ndSkies.com.
