AAPL and EBAY are the key today
As expected, the abominable earnings reports from Intel and Yahoo! after Tuesday’s close triggered a wave of tech-related selling in the Nasdaq yesterday. Although it recovered from an opening intraday loss of 1.7%, the Nasdaq Composite still finished 1.0% lower. The weakness spread to the S&P 500 and Dow Jones Industrials as well, but each index lost only 0.4%. The small-cap Russell 2000 demonstrated impressive relative strength and closed unchanged, while the mid-cap S&P 400 fell only 0.2%. Yesterday’s price divergence within the major indices tells us it was primarily the large-cap tech stocks that bore the brunt of the heavy selling.
For the second consecutive day, both the S&P and Nasdaq registered a bearish “distribution day” that was indicative of institutional selling. Total volume in the Nasdaq surged 31% higher, but volume in the NYSE crept only 3% above the previous day’s level. It was the fourth day of higher volume losses (aka “distribution”) within the past four weeks and the second this month. Given that the Nasdaq kicked off the 2006 by rallying nearly 6% on seven straight days of gains, a subsequent day or two of institutional selling should not be surprising. But now that the major indices have corrected down to key support levels, pay close attention to the price and volume patterns over the next several days. A healthy market should see only lighter volume down days over the next week, as well as at least a day or two of higher volume gains (“accumulation”). Remember that volume is the footprint of institutional activity, so a daily analysis of price and volume levels of the broad market enables us to see what is really happening “under the hood” of the markets.
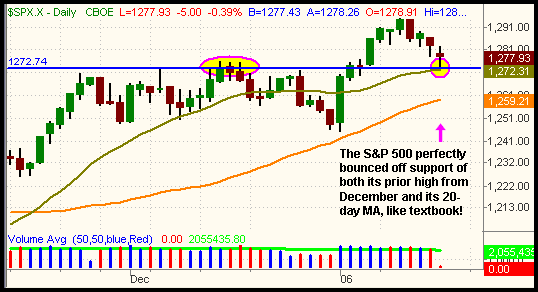
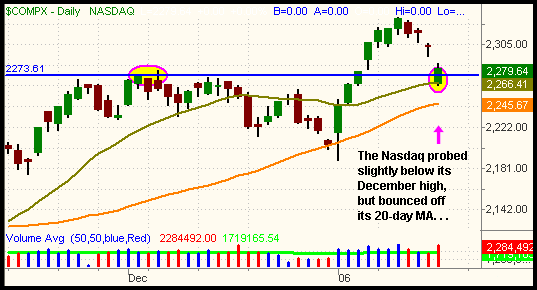
Did you notice how both the S&P 500 and Nasdaq Composite perfectly found support at the support levels we illustrated in yesterday morning’s Wagner Daily? The former highs of last December enabled the major indices to regain their footing because prior resistance levels always become the new support levels after the resistance is broken. The convergence of the 20-day moving averages near the December highs also helped to prevent further losses and perfectly marked the low of the day in both the S&P and Nasdaq:


The charts above are a great example of how the most effective methods of technical analysis are typically the most simple ones as well. Finding horizontal price support from prior highs and resistance from prior lows on daily charts is an extremely reliable, yet basic, method of technical analysis for swing trading. Comparing price action with volume spikes on daily charts is also a fundamental, yet often overlooked, method of technical analysis. Uptrending stocks, indices, and ETFs should see higher volume on many of the “up” days, but lighter volume on the “down” days. For shorting downtrends, we want to see higher volume on the “down” days and
lighter volume on the “up” days.
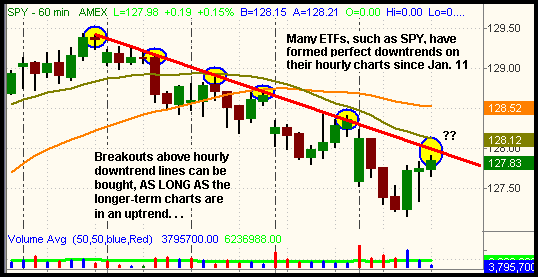
Although the S&P and Nasdaq both found support where they were “supposed to” yesterday, the big question is whether or not those support levels will hold over the next several days. Ideally, we would like to see closing prices near their intraday highs in today’s session, which would position the broad market for a rally attempt tomorrow. Obviously, higher volume on an “up” day would be bullish as well. As for potential new long entries off of support, we recommend waiting for confirmed breakouts above the downtrends on the 60-minute charts. To illustrate, we have drawn the downtrend line on the hourly chart of SPY (S&P 500) below:

Remember that the longer the time frame, the more significant the trend. Therefore, an uptrend on a daily chart holds more weight than a downtrend on a 60-minute chart. In this case, the primary uptrend on the daily chart of SPY is still intact, which is the only reason we would consider buying a breakout of the 60-minute downtrend. If doing so, your stop should be just below the absolute low of the 60-minute downtrend. There are numerous other ETFs with similar chart patterns to SPY, but this example was just for educational purposes. Other broad-based ETFs such as
(
QQQQ |
Quote |
Chart |
News |
PowerRating),
(
DIA |
Quote |
Chart |
News |
PowerRating),
(
IWM |
Quote |
Chart |
News |
PowerRating), and
(
MDY |
Quote |
Chart |
News |
PowerRating), as well as a handful of sector ETFs, are all worthy of consideration on a breakout above their 60-minute downtrend lines. Of course, all bets are off on the long side if yesterday’s lows are broken, especially if volume increases as well.
Apple Computer
(
AAPL |
Quote |
Chart |
News |
PowerRating) and eBay
(
EBAY |
Quote |
Chart |
News |
PowerRating) were the latest tech giants to report their quarterly earnings. Both were trading lower in after-hours trading yesterday, but the S&P and Nasdaq futures are currently poised for a higher open today. Earnings season is just beginning to kick into gear, so remain cognizant of important earnings dates over the next few weeks.
Open ETF positions:
Long
(
PPH |
Quote |
Chart |
News |
PowerRating) (regular subscribers to The Wagner Daily receive detailed stop and target prices on open positions and detailed setup information on new ETF trade entry prices. Intraday e-mail alerts are also sent as needed.)
Deron Wagner is the head trader of Morpheus Capital Hedge Fund and founder of Morpheus Trading Group (morpheustrading.com), which he launched in 2001. Wagner appears on his best-selling video, Sector Trading Strategies (Marketplace Books, June 2002), and is co-author of both The Long-Term Day Trader (Career Press, April 2000) and The After-Hours Trader (McGraw Hill, August 2000). Past television appearances include CNBC, ABC, and Yahoo! FinanceVision. He is also a frequent guest speaker at various trading and financial conferences around the world. For a free trial to the full version of The Wagner Daily or to learn about Deron’s other services, visit morpheustrading.com or send an e-mail to deron@morpheustrading.com
.
