Year-end spin will try to offset negative market
Kevin Haggerty is
the former head of trading for Fidelity Capital Markets. His column is
intended for more advanced traders. Kevin has trained thousands of traders
over the past decade. If you would like to be trained by him,
ext. 1
The upside reflex of
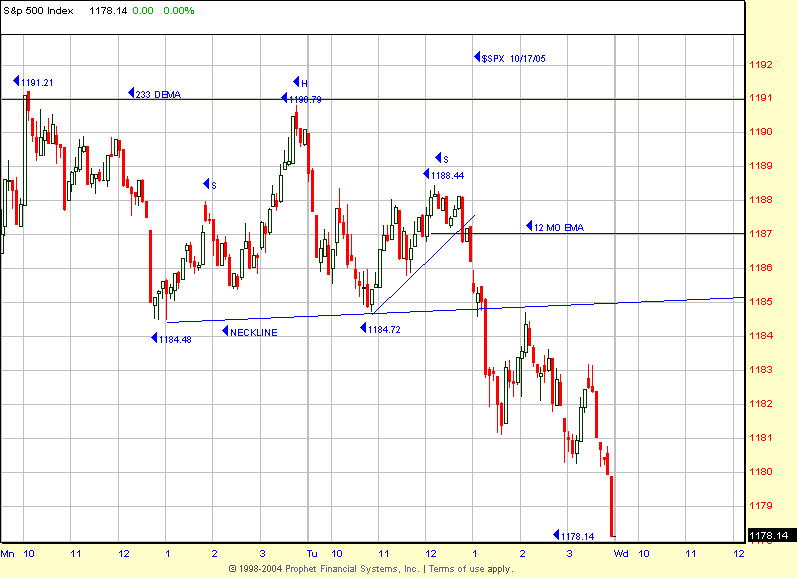
the SPX off the 1168.20 low brought in some selling at the initial
low end of the major resistance zone, which is the 12-month EMA, 1187-233 EMA,
1191. The reflex high was 1191 on Monday (10/17) then it was a decline to
1178.14 yesterday, -1%. The Dow hit its initial range resistance of 10,350 with
a 10,361 intraday high on Monday, closing yesterday at 10,286, -0.6%. NYSE
volume expanded to 1.62 billion shares with the volume ratio just 22 and breadth
+1399, certainly no positive divergence there in internals. Crude oil declined
and the
(
XLE |
Quote |
Chart |
News |
PowerRating) was -4.6%, with the
(
OIH |
Quote |
Chart |
News |
PowerRating) -4.5%.The XLE closed at 46.67
with major support 44.80 – 43.80.
Greenspan is succeeding in killing the housing
market along with the hysterical hype by the media every day for the past three
months. The
(
HGX |
Quote |
Chart |
News |
PowerRating) (Philadelphia Housing Sector Index) has declined -20% so
far from the 587 07/29/05 high. He continues to raise short term rates and
creates concern about an inverted yield curve, which has never failed to produce
a recession, or at minimum a significant slowdown. However, Greenspan has been
pumping up the money supply big time (M3) as he talks inflation out of the other
side of his mouth. The Generals have been bailing out of economic sensitive
stocks, which started well before any of the current concerns, and obviously
anticipated an economic downturn
Yesterday the
(
XLU |
Quote |
Chart |
News |
PowerRating) (utilities) was -1.78%,
Transportation (TRAN) -1.5%,
(
XLB |
Quote |
Chart |
News |
PowerRating) (basic materials) -1.1% and
(
XLY |
Quote |
Chart |
News |
PowerRating)
(consumer discretionary) -1.1%, so the economic downturn theme was the leader
yesterday.
Daytraders had an excellent day from the short
side yesterday trading the SPX (futures/SPY). There was an afternoon re-cross of
the 12-month EMA to the downside, then a head and shoulder break below 1184.72
which traded down to the 1178.14 close (see chart).
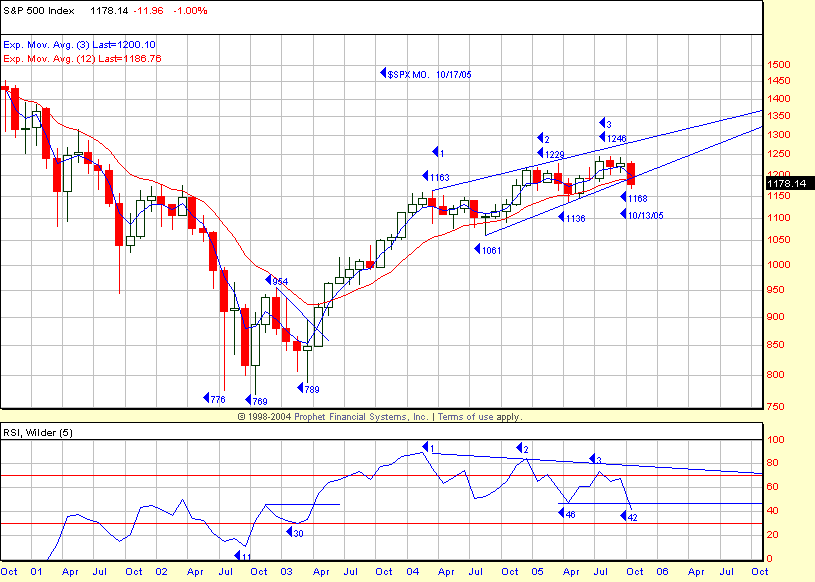
This bull cycle is three years old and the SPX
monthly chart today shows the rising wedge breakdown. This followed a negative
divergence in the 5-month RSI. The 40-week and 200-day EMAs are up at the 1196
zone and I would assume many of the mutual fund market timing systems have
significantly reduced their equity allocation on this current decline below the
longer-term moving averages. The SPX had gotten to within 0.6% (1246) of the
1254, .618 retracement to 1553 from 769. It was this symmetry, along with the
negative momentum divergence, length of this bull cycle and obvious prior
deterioration of the economic sensitive sectors and failure of the Dow to
confirm the SPX 1246 new high that prompted the course of action that this
corner has taken, which is explained in the 10/17/05 commentary (Current
Market Perspectives). In addition to that, when the SPX is < the 40-week MA
and the $TYX (long bond yield) is > its 40-week MA–as they currently are–it
historically is not a good time for the market.
From this current oversold condition, the spin
will get louder about the best 6 months of the year–November-April–Christmas
rally and institutional markup to make the year 2005 close on the positive side
(above the SPX 1211.92 12/31/04 close). Stay with the daytrading/short-term
posture in the major indices. This is option expiration week in addition to
multiple time symmetry on 10/20 (+/- 2 days) so there should be some more good
intraday volatility.
Have a good trading day,
Kevin Haggerty
P.S. The next commentary will be Friday.


